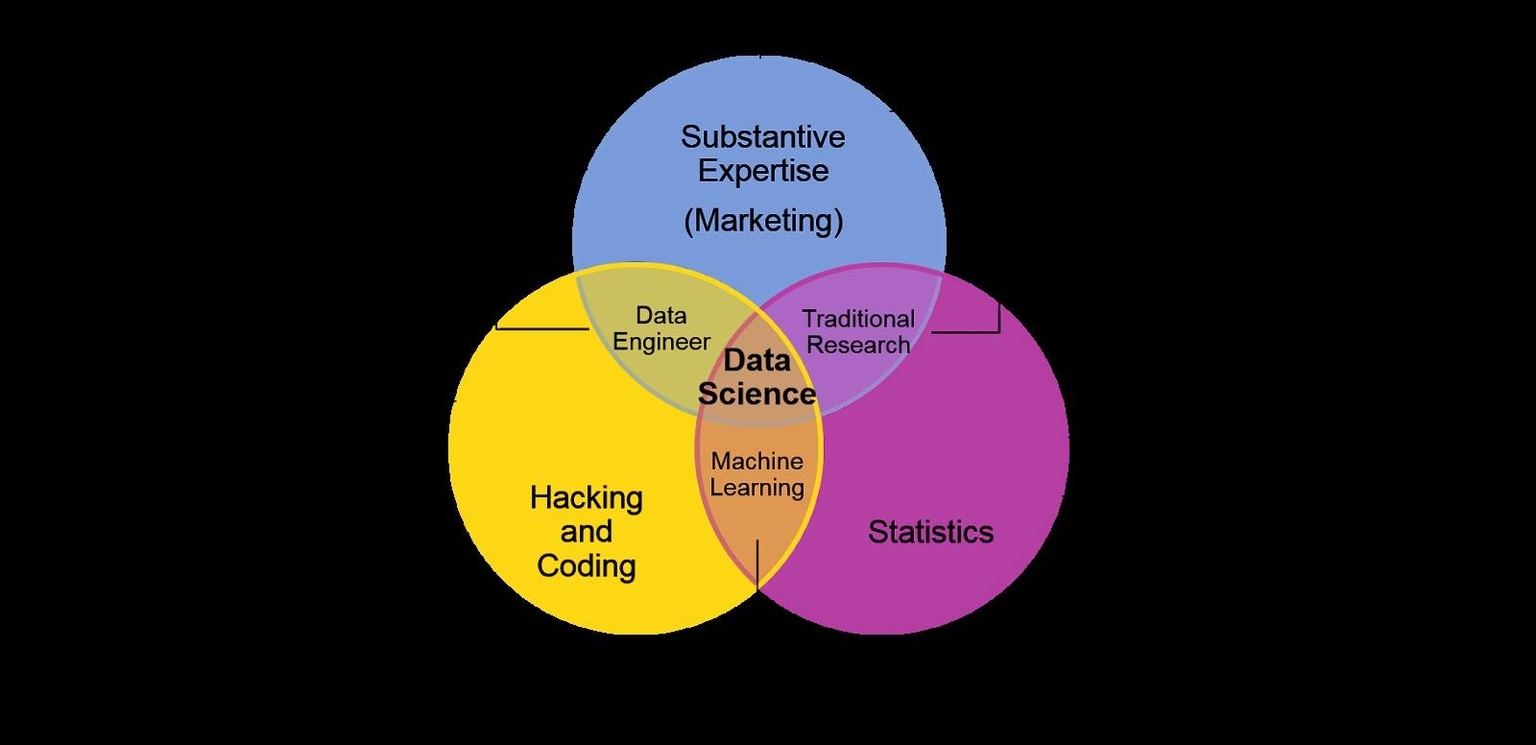
Venn Diagram Graphic: A Venn diagram is a graphic organizer that uses overlapping circles to illustrate the relationships between different sets. It highlights similarities and differences, making it a useful tool for comparing and contrasting information.
