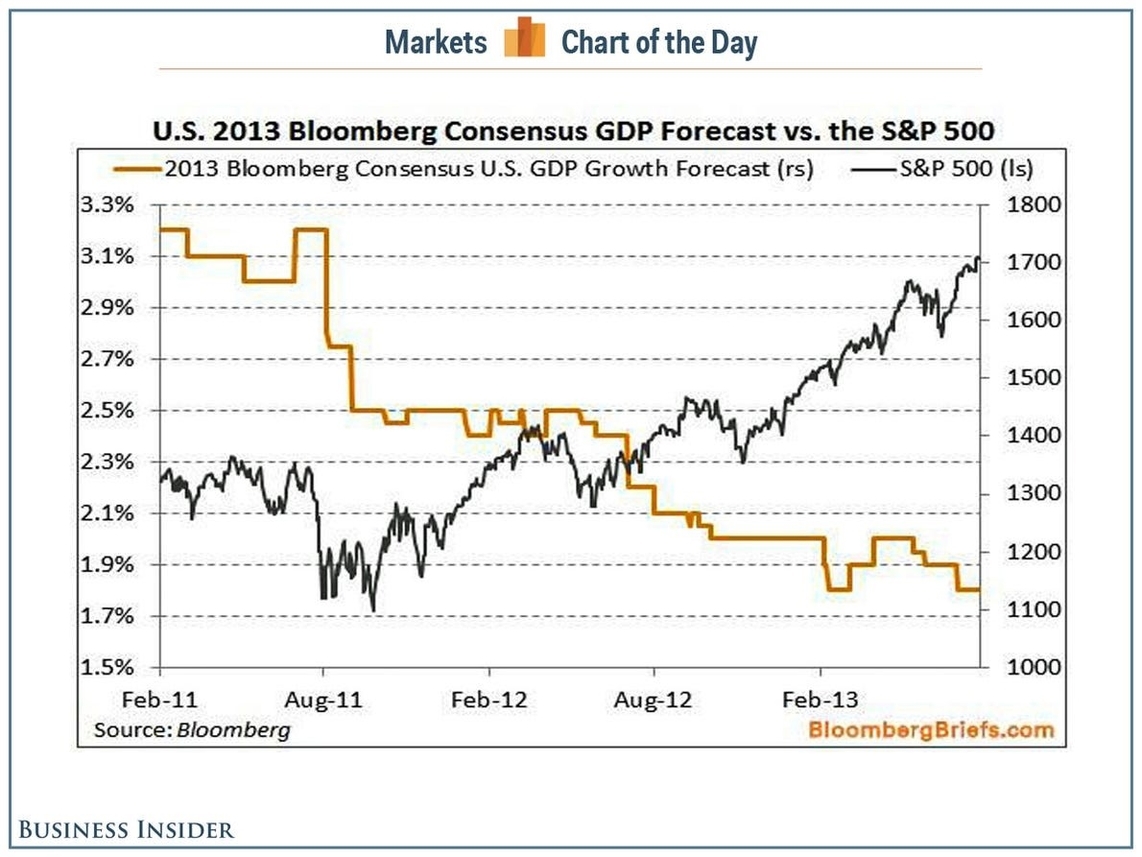
Stock market growth is the increase in the value of stocks over time. Stocks are shares of ownership in a company that can be bought and sold on a stock exchange. Stock market growth can be measured by various indicators, such as the Dow Jones Industrial Average (DJIA), the S&P 500, or the Nasdaq Composite. These are indexes that track the performance of a group of stocks from different sectors and industries.
tock market growth depends on many factors, such as the economic conditions, corporate earnings, investor sentiment, interest rates, inflation, geopolitical events, and technological innovations. Stock market growth can benefit investors who hold stocks for a long period of time, as they can enjoy capital appreciation and dividends. However, stock market growth also involves risks, such as volatility, market crashes, bubbles, and fraud.
tock market growth can be classified into two types: value and growth. Value stocks are those that are undervalued by the market, meaning that their current price is lower than their intrinsic value. Value investors look for stocks that have strong fundamentals, such as earnings, assets, cash flow, and dividends, but are trading at a discount. Value stocks tend to have lower price-to-earnings (P/E) ratios and higher dividend yields than the market average.
Growth stocks are those that have high potential for future growth, meaning that their current earnings and revenues are expected to increase significantly in the future. Growth investors look for stocks that have innovative products, services, or business models, and are dominating their markets or creating new ones. Growth stocks tend to have higher P/E ratios and lower dividend yields than the market average.
The performance of value and growth stocks can vary depending on the market cycle. Generally, value stocks tend to outperform growth stocks during recessions, when investors seek safety and stability, and growth stocks tend to outperform value stocks during expansions, when investors seek higher returns and growth opportunities. However, there are exceptions and anomalies to this pattern, as some stocks can exhibit both value and growth characteristics, or switch between them over time.
The average stock market return over the past 10 years, as measured by the S&P 500, was about 12.39% annually. This means that if an investor invested $100 in the S&P 500 at the beginning of 2014, they would have $339.92 at the end of 2023, assuming they reinvested all dividends. However, this does not account for inflation, taxes, fees, or individual stock performance, which can affect the actual return of an investor.
The following is a table that shows the annual
