Skip to content
cropped logo

Ygraph

Charts, Graphs and Diagrams

Menu

Primary menu

  • Submit Diagram
  • Science
  • Business
  • Economy
    • GDP
  • Demographics
  • Explained
    • Signs
    • Maps
  • Health
  • Anatomy
  • Sizes

Media Bias Chart For Us News Sources

Media Bias Chart For Us News Sources

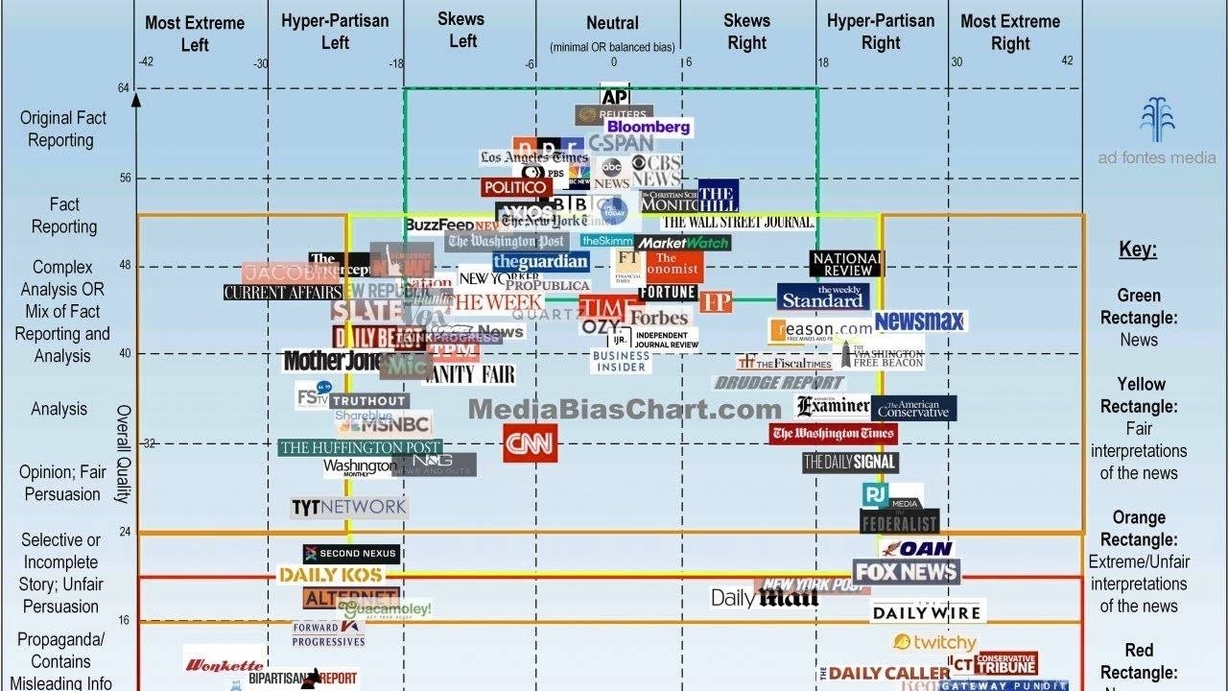
Media Bias For Us News Sources: Media bias for US news sources highlights the inclination of American news outlets to present information in a way that aligns with specific political or ideological stances. This bias can affect the objectivity and balance of news coverage.

media analysis chart, media bias in US sources, news coverage comparison, political bias in news visual, US news media bias diagram

Post navigation

← Previous Previous post: Micronesia Population
Next → Next post: Free Body Diagram

Primary Sidebar Widget Area

Top Diagrams

Latest Posts

  • How to Stop Time from Flying
  • Circular Flow Of Economy
  • Bulgaria Population
  • 2018 2019 Bar Graph
  • Shirt Neck Size Chart
  • Malta Births per woman
  • Venn Diagram Of Health Professions
  • Vanuatu Births per woman
  • Kosovo Population
  • Gibraltar Population
  • Guinea Bissau Population
  • East Asia & Pacific Births per woman
  • France Births per woman
  • St. Lucia Births per woman
  • Brunei Darussalam Births per woman

Top Tags

  • sizes (35)
  • size chart (35)
  • size conversion (35)
  • economy chart (33)
  • economy graph (33)
  • economy diagram (33)
  • cell (29)
  • cell diagram (29)
  • cell illustration (29)
  • window (24)
  • window diagram (24)
  • types of windows (24)
  • origami (16)
  • origami steps (16)
  • how to make origami (16)
  • biology (16)
  • biology diagram (16)
  • yoga (8)
  • yoga routine (8)
  • yoga poses (8)

Categories

  • anatomy
  • Business
  • chart
  • Demographics
  • Eco
  • Ecom
  • Economy
  • Explained
  • GDP
  • Health
  • Maps
  • notice
  • science
  • Signs
  • Sizes
  • Uncategorized

Useful Resources

  • Chart Diagram
  • Meme Gif
  • Logo Sign
  • Human Anatomy
  • Graph Diagram
  • Economy GDP
  • Twitter
Copyright © 2025 Ygraph. All Rights Reserved.
Theme: Catch Box by Catch Themes
Scroll Up
WP Twitter Auto Publish Powered By : XYZScripts.com