A Venn diagram is a diagram that helps us visualize the logical relationship between sets and their elements and helps us solve examples based on these sets. Venn diagrams are also called logic or set diagrams and are widely used in set theory, logic, mathematics, businesses, teaching, computer science, and statistics.
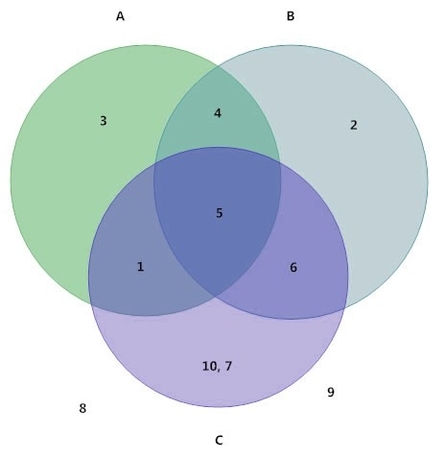
A Venn diagram typically uses intersecting and non-intersecting circles (although other closed figures like squares may be used) to denote the relationship between sets. The circles represent sets, and the overlapping regions represent the intersection of the sets. The non-overlapping regions represent the difference between the sets. The universal set is the set of all possible elements, and it is usually represented by a rectangle that encloses all the circles.
Venn diagrams are used to visually represent the differences and similarities between two or more concepts. They are used to show subsets, set operations, and cardinality of sets. A subset is actually a set that is contained within another set. Set operations include union, intersection, and complement. The cardinality of a set is the number of elements in the set.
To draw a Venn diagram, we first consider a larger set called a universal set that contains all of the elements in all of the sets that are being considered. A large rectangle is used to represent the universal set, and it is usually denoted by the symbol E or sometimes U. All the other sets are represented by circles or closed figures within this larger rectangle. Every set is the subset of the universal set U.
Venn diagrams are used in various fields. In mathematics, they are used to represent sets and their relationships. In computer science, they are used to represent logical operations and data structures. In statistics, they are used to represent probability and statistical data. In business, they are used to represent market segments and customer preferences. In teaching, they are used to represent concepts and relationships between them.
In summary, Venn diagrams are a powerful tool for visualizing the relationships between sets and their elements. They are widely used in various fields, including mathematics, computer science, statistics, business, and teaching. They help us solve problems based on sets and their relationships, and they are an essential tool for anyone studying these fields..