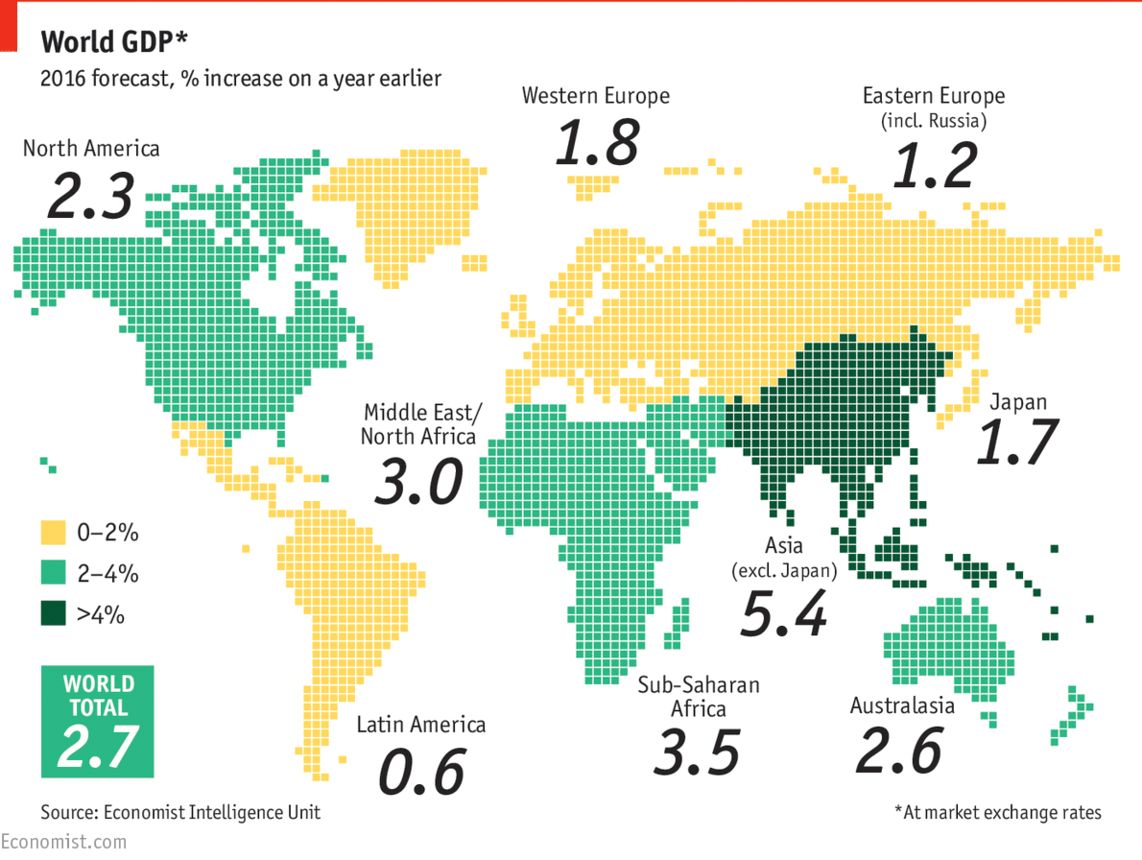
See the below image for the GDP growth worldwide map diagram. World gdp growth rate for 2019 was 2.33%, a 0.7% decline from 2018. World gdp growth rate for 2018 was 3.03%, a 0.25% decline from 2017. World gdp growth rate for 2017 was 3.28%, a 0.67% increase from 2016.
The map below compiles data on economic growth in ninety-one countries around the world, mainly those that report quarterly data to the International Monetary Fund (IMF).
The U.S. State of California accounts for 3.7% of the world’s GDP by itself, which ranks higher than the United Kingdom’s total contribution of 3.3%. Canada as a country accounts for 2% of the world’s GDP, which is comparable to the GDP contribution of the Greater Tokyo Area at 2.2%.