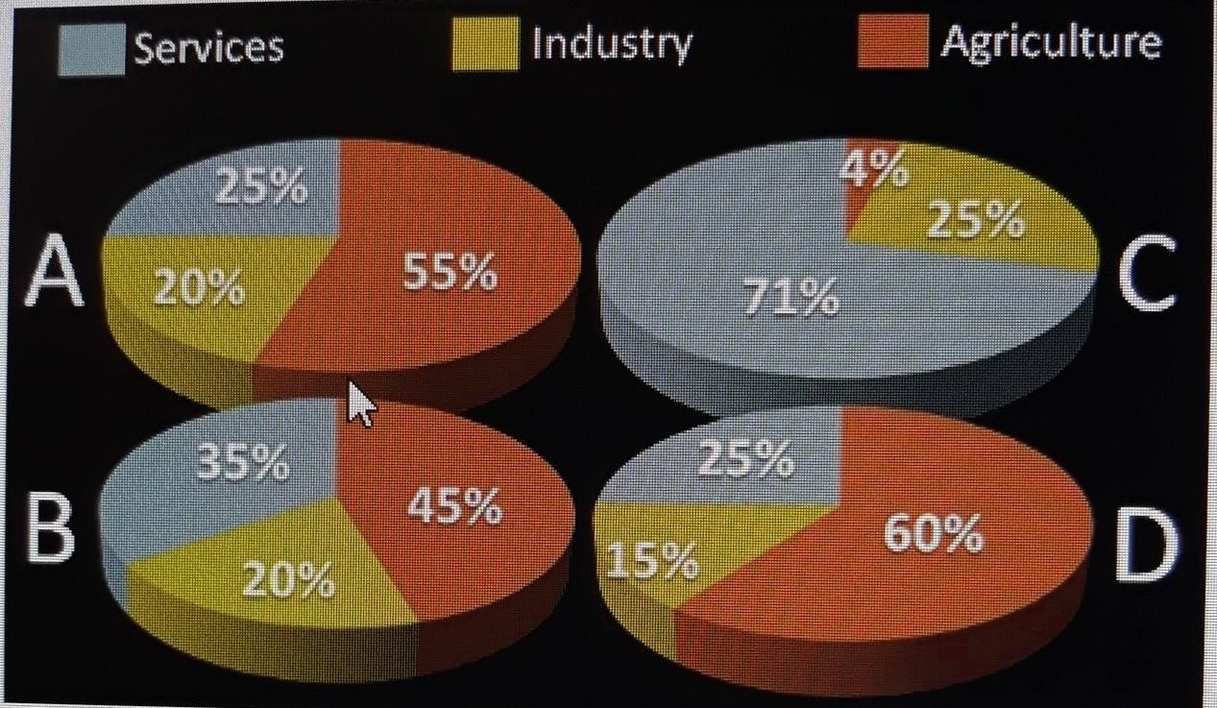
GDP composition by sector is a way of measuring the contribution of different economic sectors to the total gross domestic product (GDP) of a country or region. GDP is the monetary value of all the final goods and services produced within a given period of time. Economic sectors are broad categories of economic activities that share common characteristics, such as agriculture, industry, and services.
The most common way of dividing the economy into sectors is based on the three-sector theory, which distinguishes between primary, secondary, and tertiary sectors. The primary sector includes activities that directly extract or harvest natural resources, such as agriculture, forestry, fishing, and mining. The secondary sector includes activities that transform raw materials into finished or semi-finished products, such as manufacturing, construction, and utilities. The tertiary sector includes activities that provide services to consumers or other businesses, such as trade, transport, communication, education, health, finance, and government.
The GDP composition by sector can vary significantly across countries and regions, depending on their level of development, natural endowments, economic policies, and historical factors. Generally, less developed countries tend to have a larger share of GDP from the primary sector, while more developed countries tend to have a larger share of GDP from the tertiary sector. The secondary sector usually peaks at an intermediate stage of development, as countries undergo industrialization and urbanization. However, there are also exceptions and variations to this pattern, as some countries may specialize in certain sectors due to comparative advantages or strategic choices.
The GDP composition by sector can also change over time, as countries experience structural transformation, which is the process of shifting the allocation of resources and output from one sector to another. Structural transformation is often driven by changes in technology, productivity, demand, trade, and institutions, which affect the relative profitability and competitiveness of different sectors. Structural transformation can have significant implications for economic growth, employment, income distribution, and environmental sustainability.
The following table shows the GDP composition by sector for some selected countries and regions, based on the nominal GDP data from the World Bank for the year 2023. The table also shows the real GDP data from the International Monetary Fund for the year 2017, which are adjusted for price differences and inflation. The table illustrates the diversity and dynamics of the GDP composition by sector across the world.
| Country/Region | Nominal GDP (USD$) | Primary (%) | Secondary (%) | Tertiary (%) | Real GDP (US$MM) | Primary (%) | Secondary (%) | Tertiary (%) |
| World | 104,480 | 5.9 | 30.5 | 63.6 | 127,800,000 | 6.4 | 30.0 | 63.6 |
| China | 17,700 | 6.9 | 40.1 | 52.9 | 23,210,000 | 7.9 | 40.5 | 51.6 |
| USA | 26,950 | 1.12 | 19.1 | 79.7 | 19,490,000 | 0.9 | 19.1 | 80.0 |
| India | 3,730 | 17.4 | 25.8 | 56.9 | 9,474,000 | 15.4 | 23.0 | 61.6 |
| Japan | 4,230 | 1.2 | 27.5 | 71.4 | 5,443,000 | 1.2 | 27.8 | 71.0 |
| Canada | 2,120 | 1.8 | 28.6 | 69.6 | 1,847,000 | 1.6 | 28.2 | 70.2 |
