Skip to content
cropped logo

Ygraph

Charts, Graphs and Diagrams

Menu

Primary menu

  • Submit Diagram
  • Science
  • Business
  • Economy
    • GDP
  • Demographics
  • Explained
    • Signs
    • Maps
  • Health
  • Anatomy
  • Sizes

Circular Flow Diagram

Circular Flow Diagram

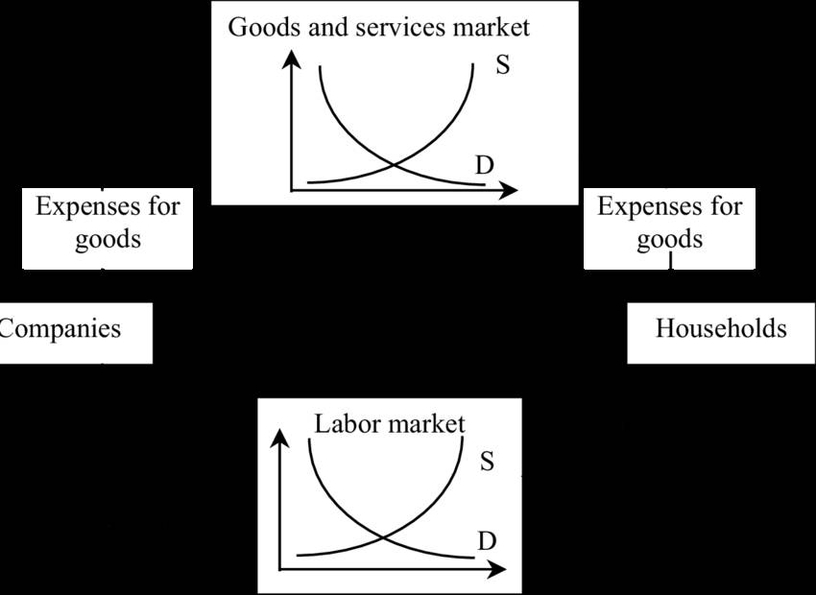
Circular Flow Diagram: A circular flow diagram represents the flow of goods, services, and money in an economy. It illustrates the interactions between households, businesses, and the government, highlighting how economic activities are interconnected.

circular flow diagram economics, economic model visual, households and firms flow, income and spending chart, macroeconomic cycle diagram

Post navigation

← Previous Previous post: Three Domains Of Organisms
Next → Next post: Greenland Births per woman

Primary Sidebar Widget Area

Top Diagrams

Latest Posts

  • Gcse Biology Aqa Genetic Diagrams Worksheet
  • Quantum Physics Diagram
  • Parts Of The Brain
  • Sweden Population
  • Guatemala Births per woman
  • Bangladesh Births per woman
  • Functional Divisions Of Nervous System
  • Malawi Births per woman
  • Human Cell with Detailed Labels
  • Multiple Cell Diagram with Labels
  • Open and Closed Stomatal Pore
  • Flower Anatomy Diagram
  • Animal Cell Diagram
  • The Layers of Human Skin
  • French Polynesia Births per woman

Top Tags

  • sizes (35)
  • size chart (35)
  • size conversion (35)
  • economy chart (33)
  • economy graph (33)
  • economy diagram (33)
  • cell (29)
  • cell diagram (29)
  • cell illustration (29)
  • window (24)
  • window diagram (24)
  • types of windows (24)
  • origami (16)
  • origami steps (16)
  • how to make origami (16)
  • biology (16)
  • biology diagram (16)
  • yoga (8)
  • yoga routine (8)
  • yoga poses (8)

Categories

  • anatomy
  • Business
  • chart
  • Demographics
  • Eco
  • Ecom
  • Economy
  • Explained
  • GDP
  • Health
  • Maps
  • notice
  • science
  • Signs
  • Sizes
  • Uncategorized

Useful Resources

  • Chart Diagram
  • Meme Gif
  • Logo Sign
  • Human Anatomy
  • Graph Diagram
  • Economy GDP
  • Twitter
Copyright © 2025 Ygraph. All Rights Reserved.
Theme: Catch Box by Catch Themes
Scroll Up
WP Twitter Auto Publish Powered By : XYZScripts.com