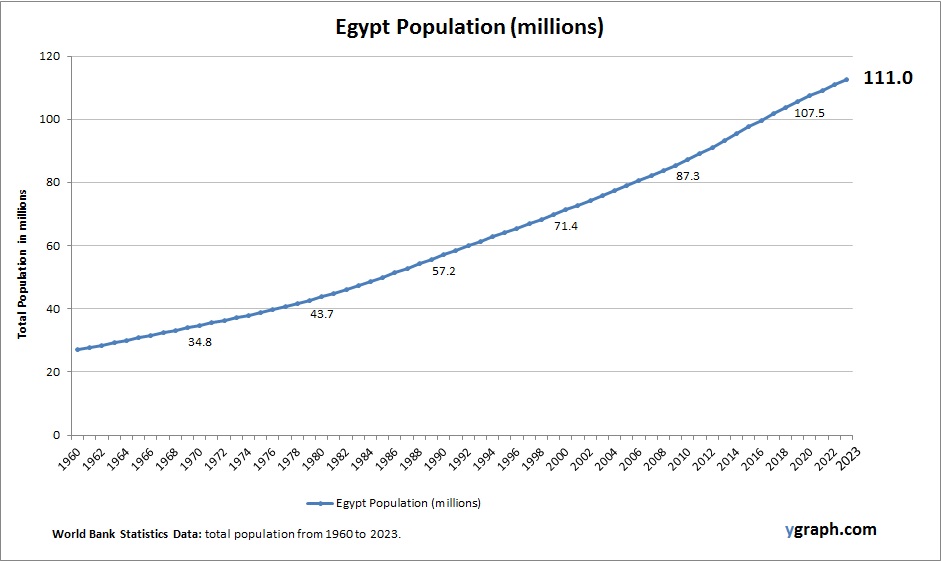
Burkina Faso Births per woman

Chart above demonstrates Burkina Faso Births per woman. This is according to World Bank birth stats by country. Based on the latest available information for Burkina Faso.

Burkina Faso has very high fertility rates driven by cultural norms, limited access to contraception, and rural populations. The country experiences rapid population growth with a young demographic profile, challenging infrastructure, education, and health systems.

Burkina Faso Births per woman

Africa Eastern and Southern Births per woman

The above graph shows Africa Eastern and Southern Births per woman. This is according to World Bank birth stats by country. Latest births per woman information for Africa Eastern and Southern.

The Eastern and Southern regions of Africa show varied but generally high fertility rates, although several countries are undergoing demographic transitions. Urbanization, better access to education, and growing health infrastructure are gradually reducing birth rates, especially in nations like Kenya and South Africa.

Africa Eastern and Southern Births per woman

Afghanistan Population

The above graph shows Afghanistan Population. World Bank is the source of this population data. Latest population information for Afghanistan.

Afghanistan has a youthful and rapidly growing population, with high fertility rates influenced by cultural traditions and limited access to family planning. Political instability and conflict impact demographic trends, with significant rural populations and ongoing migration patterns.

Afghanistan Population

Caribbean small states Births per woman

Chart above demonstrates Caribbean small states Births per woman. The fertility rate statistics are compiled by World Bank. Based on the latest available information for Caribbean small states.

Fertility rates in Caribbean small states vary but generally show a downward trend. Improved access to education and healthcare, coupled with urbanization and migration, are influencing family size preferences across the region.

Caribbean small states Births per woman

Cambodia Births per woman

Chart above demonstrates Cambodia Births per woman. World Bank is the source of this birth data. Based on the latest demographics info provided for Cambodia.

Cambodia’s fertility rate has declined significantly over the past few decades due to improved access to education, healthcare, and family planning. While rural areas still see higher birth rates, urban centers are experiencing a marked demographic shift toward smaller family sizes.

Cambodia Births per woman

Czechia Births per woman

Chart above demonstrates Czechia Births per woman. World Bank is the source of this birth data. Latest births per woman information for Czechia.

Czechia has a fertility rate below the replacement level, similar to many European countries. Though it has seen slight improvements due to family-friendly policies like paid parental leave and childcare support, the birth rate remains low, contributing to population aging and workforce challenges.

Czechia Births per woman

Egypt Births per woman

Chart above demonstrates Egypt Births per woman. This is according to World Bank birth stats by country. Latest births per woman information for Egypt.

Egypt has moderate to high fertility rates, although these have been gradually declining due to urbanization, education, and improved healthcare access. The youthful population continues to grow rapidly, creating both opportunities and challenges for economic and social development.

Egypt Births per woman

East Asia & Pacific Population

The above graph shows East Asia & Pacific Population. This is according to World Bank total population stats. Based on the latest available information for East Asia & Pacific.

The East Asia & Pacific region features a large and diverse population with varying growth rates. While countries like China and Japan face aging and low fertility, others such as the Philippines and Indonesia maintain youthful, growing populations.

East Asia & Pacific Population

Chile Births per woman

The above graph shows Chile Births per woman. World Bank is the source of this birth data. Based on the latest demographics info provided for Chile.

Chile has seen a steady decline in fertility rates, now near or below replacement level. Economic development, urbanization, and expanded access to education and healthcare have contributed to smaller family sizes across the country.

Chile Births per woman

Congo Democratic Republic Births per woman

The above graph shows Congo Democratic Republic Births per woman. World Bank is the source of this birth data. Based on the latest available information for Congo Democratic Republic.

The Democratic Republic of the Congo has one of the highest fertility rates in the world, with women averaging more than six children. This high rate reflects limited access to contraception, early marriage, and cultural norms favoring large families. The rapid population growth presents challenges for education, health services, and economic development.

Congo Democratic Republic Births per woman