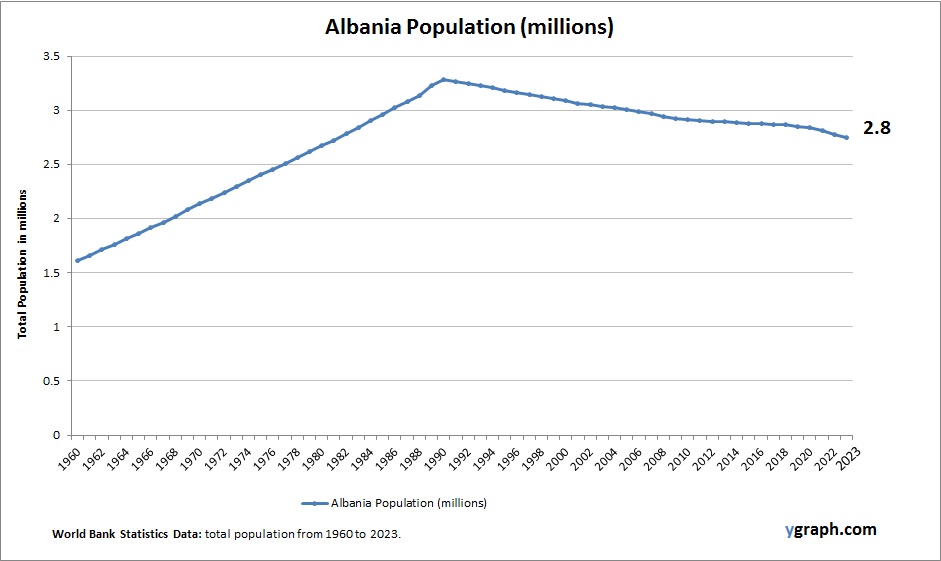
Costa Rica Population

This diagram presents Costa Rica Population. This is according to World Bank total population stats. Based on the latest demographics info provided for Costa Rica.

Costa Rica’s population has stabilized in recent years, with a declining fertility rate and increasing life expectancy. The country boasts a strong healthcare system and progressive social policies that support education and gender equality, contributing to demographic shifts. Urban areas are seeing slower growth compared to rural migration patterns, and the aging population is emerging as a new focus for public policy.

Costa Rica Population

Bahrain Births per woman

The above graph shows Bahrain Births per woman. The fertility rate statistics are compiled by World Bank. Based on the latest available information for Bahrain.

Bahrain experiences low fertility rates typical of high-income Gulf countries, influenced by urban lifestyles, higher education levels, and widespread access to reproductive healthcare. Economic development and labor market dynamics also impact family size decisions, as many residents delay childbirth. The native Bahraini population grows slowly, but overall population increases are supported by substantial immigration, especially of foreign workers who tend to have different demographic profiles.

Bahrain Births per woman

Ecuador Population

This diagram presents Ecuador Population. This is according to World Bank total population stats. Based on the latest demographics info provided for Ecuador.

Ecuador’s population is steadily growing, supported by moderate fertility rates and decreasing mortality rates. Urbanization, improvements in healthcare, and access to education have shifted the demographic structure, with a growing middle class and reduced population growth compared to earlier decades.

Ecuador Population

Equatorial Guinea Births per woman

Chart above demonstrates Equatorial Guinea Births per woman. World Bank is the source of this birth data. Latest births per woman information for Equatorial Guinea.

Equatorial Guinea maintains a high fertility rate, supported by traditional family values and limited access to family planning in rural areas. Despite oil wealth, social development indicators remain low, affecting maternal health and education outcomes.

Equatorial Guinea Births per woman

Armenia Population

Chart above demonstrates Armenia Population. This is according to World Bank total population stats. Based on the latest available information for Armenia.

Armenia’s population is gradually declining due to low fertility rates and high levels of emigration. The demographic structure reflects an aging trend, with the government promoting incentives to reverse population decline and retain young professionals.

Armenia Population

Dominican Republic Population

The above graph shows Dominican Republic Population. This is according to World Bank total population stats. Based on the latest available information for Dominican Republic.

The Dominican Republic has a growing population fueled by moderate fertility rates and a youthful age structure. Urbanization is increasing, particularly in Santo Domingo, contributing to economic development and demographic shifts. Healthcare improvements and education access support gradual declines in birth rates.

Dominican Republic Population

Bosnia and Herzegovina Population

The above graph shows Bosnia and Herzegovina Population. This is according to World Bank total population stats. Based on the latest demographics info provided for Bosnia and Herzegovina.

Bosnia and Herzegovina has a declining and aging population influenced by low fertility rates and significant emigration. The country’s complex ethnic composition and post-conflict recovery affect migration and demographic stability. Urban centers maintain population levels better than rural areas, where decline is more pronounced. Economic challenges and political fragmentation impact demographic policies.

Bosnia and Herzegovina Population

Equatorial Guinea Population

Chart above demonstrates Equatorial Guinea Population. World Bank is the source of this population data. Based on the latest demographics info provided for Equatorial Guinea.

Equatorial Guinea has a small but growing population characterized by high fertility rates and a youthful age structure. Economic wealth from oil has fueled urban growth, particularly in the capital Malabo, but demographic challenges include uneven access to healthcare and infrastructure outside urban centers.

Equatorial Guinea Population

Bulgaria Population

This diagram presents Bulgaria Population. The country statistics are compiled by World Bank. Based on the latest demographics info provided for Bulgaria.

Bulgaria faces population decline driven by very low fertility rates and high emigration. The aging population poses significant challenges for social services and economic sustainability. Urban areas have relatively stable populations, but rural depopulation is pronounced. Policies aim to reverse demographic decline and support family growth.

Bulgaria Population

East Asia & Pacific Births per woman

The above graph shows East Asia & Pacific Births per woman. The fertility rate statistics are compiled by World Bank. Based on the latest available information for East Asia & Pacific.

Across the East Asia and Pacific region, fertility rates have dropped significantly, in some countries falling well below replacement levels. Nations such as Japan, South Korea, and China are dealing with aging populations, while others like Vietnam and Indonesia maintain slightly higher fertility rates. Economic development, urbanization, and gender equality initiatives have all contributed to these demographic changes.

East Asia & Pacific Births per woman