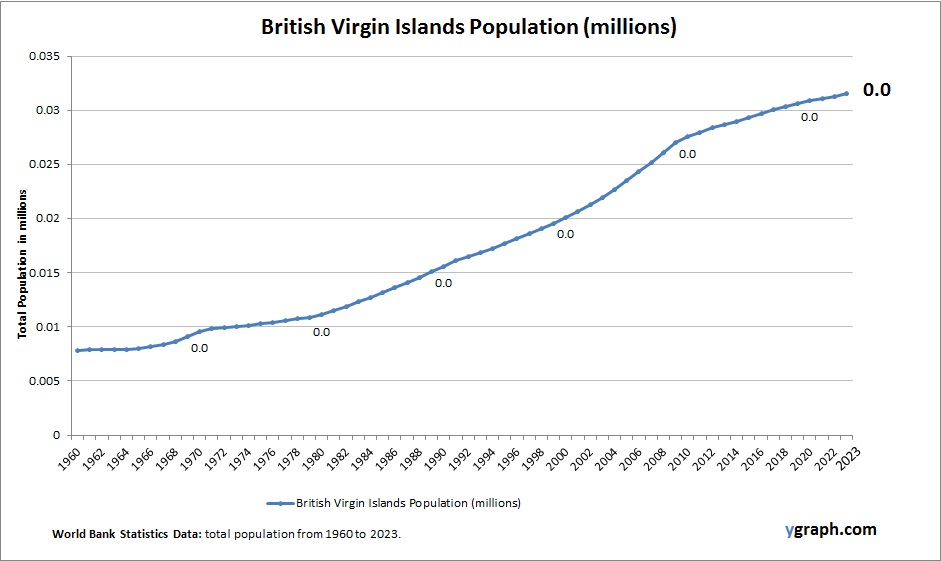
Caribbean small states Births per woman

Chart above demonstrates Caribbean small states Births per woman. The fertility rate statistics are compiled by World Bank. Based on the latest available information for Caribbean small states.

Fertility rates in Caribbean small states vary but generally show a downward trend. Improved access to education and healthcare, coupled with urbanization and migration, are influencing family size preferences across the region.

Caribbean small states Births per woman

Cambodia Births per woman

Chart above demonstrates Cambodia Births per woman. World Bank is the source of this birth data. Based on the latest demographics info provided for Cambodia.

Cambodia’s fertility rate has declined significantly over the past few decades due to improved access to education, healthcare, and family planning. While rural areas still see higher birth rates, urban centers are experiencing a marked demographic shift toward smaller family sizes.

Cambodia Births per woman

Czechia Births per woman

Chart above demonstrates Czechia Births per woman. World Bank is the source of this birth data. Latest births per woman information for Czechia.

Czechia has a fertility rate below the replacement level, similar to many European countries. Though it has seen slight improvements due to family-friendly policies like paid parental leave and childcare support, the birth rate remains low, contributing to population aging and workforce challenges.

Czechia Births per woman

Egypt Births per woman

Chart above demonstrates Egypt Births per woman. This is according to World Bank birth stats by country. Latest births per woman information for Egypt.

Egypt has moderate to high fertility rates, although these have been gradually declining due to urbanization, education, and improved healthcare access. The youthful population continues to grow rapidly, creating both opportunities and challenges for economic and social development.

Egypt Births per woman

East Asia & Pacific Population

The above graph shows East Asia & Pacific Population. This is according to World Bank total population stats. Based on the latest available information for East Asia & Pacific.

The East Asia & Pacific region features a large and diverse population with varying growth rates. While countries like China and Japan face aging and low fertility, others such as the Philippines and Indonesia maintain youthful, growing populations.

East Asia & Pacific Population

Chile Births per woman

The above graph shows Chile Births per woman. World Bank is the source of this birth data. Based on the latest demographics info provided for Chile.

Chile has seen a steady decline in fertility rates, now near or below replacement level. Economic development, urbanization, and expanded access to education and healthcare have contributed to smaller family sizes across the country.

Chile Births per woman

Congo Democratic Republic Births per woman

The above graph shows Congo Democratic Republic Births per woman. World Bank is the source of this birth data. Based on the latest available information for Congo Democratic Republic.

The Democratic Republic of the Congo has one of the highest fertility rates in the world, with women averaging more than six children. This high rate reflects limited access to contraception, early marriage, and cultural norms favoring large families. The rapid population growth presents challenges for education, health services, and economic development.

Congo Democratic Republic Births per woman

Costa Rica Births per woman

This diagram presents Costa Rica Births per woman. This is according to World Bank birth stats by country. Latest births per woman information for Costa Rica.

Costa Rica has moderate fertility rates that have been declining due to improved education and healthcare. Population growth is slowing, with urbanization and economic development influencing family size decisions. The country benefits from a youthful demographic relative to some developed nations.

Costa Rica Births per woman

Albania Births per woman

This diagram presents Albania Births per woman. The fertility rate statistics are compiled by World Bank. Based on the latest demographics info provided for Albania.

Albania has experienced declining fertility rates in recent decades due to urbanization, improved education, and healthcare access. Though birth rates are below replacement level, a youthful population still supports modest growth. Migration and economic development also influence demographic trends.

Albania Births per woman

Arab World Population

The above graph shows Arab World Population. World Bank is the source of this population data. Based on the latest demographics info provided for Arab World.

The Arab World as a region has experienced significant population growth, fueled by high fertility rates and a youthful demographic structure. While some countries like Lebanon and Tunisia are seeing declines in births per woman, others such as Yemen and Iraq still have high fertility. Urbanization and economic development are beginning to reshape these dynamics.

Arab World Population