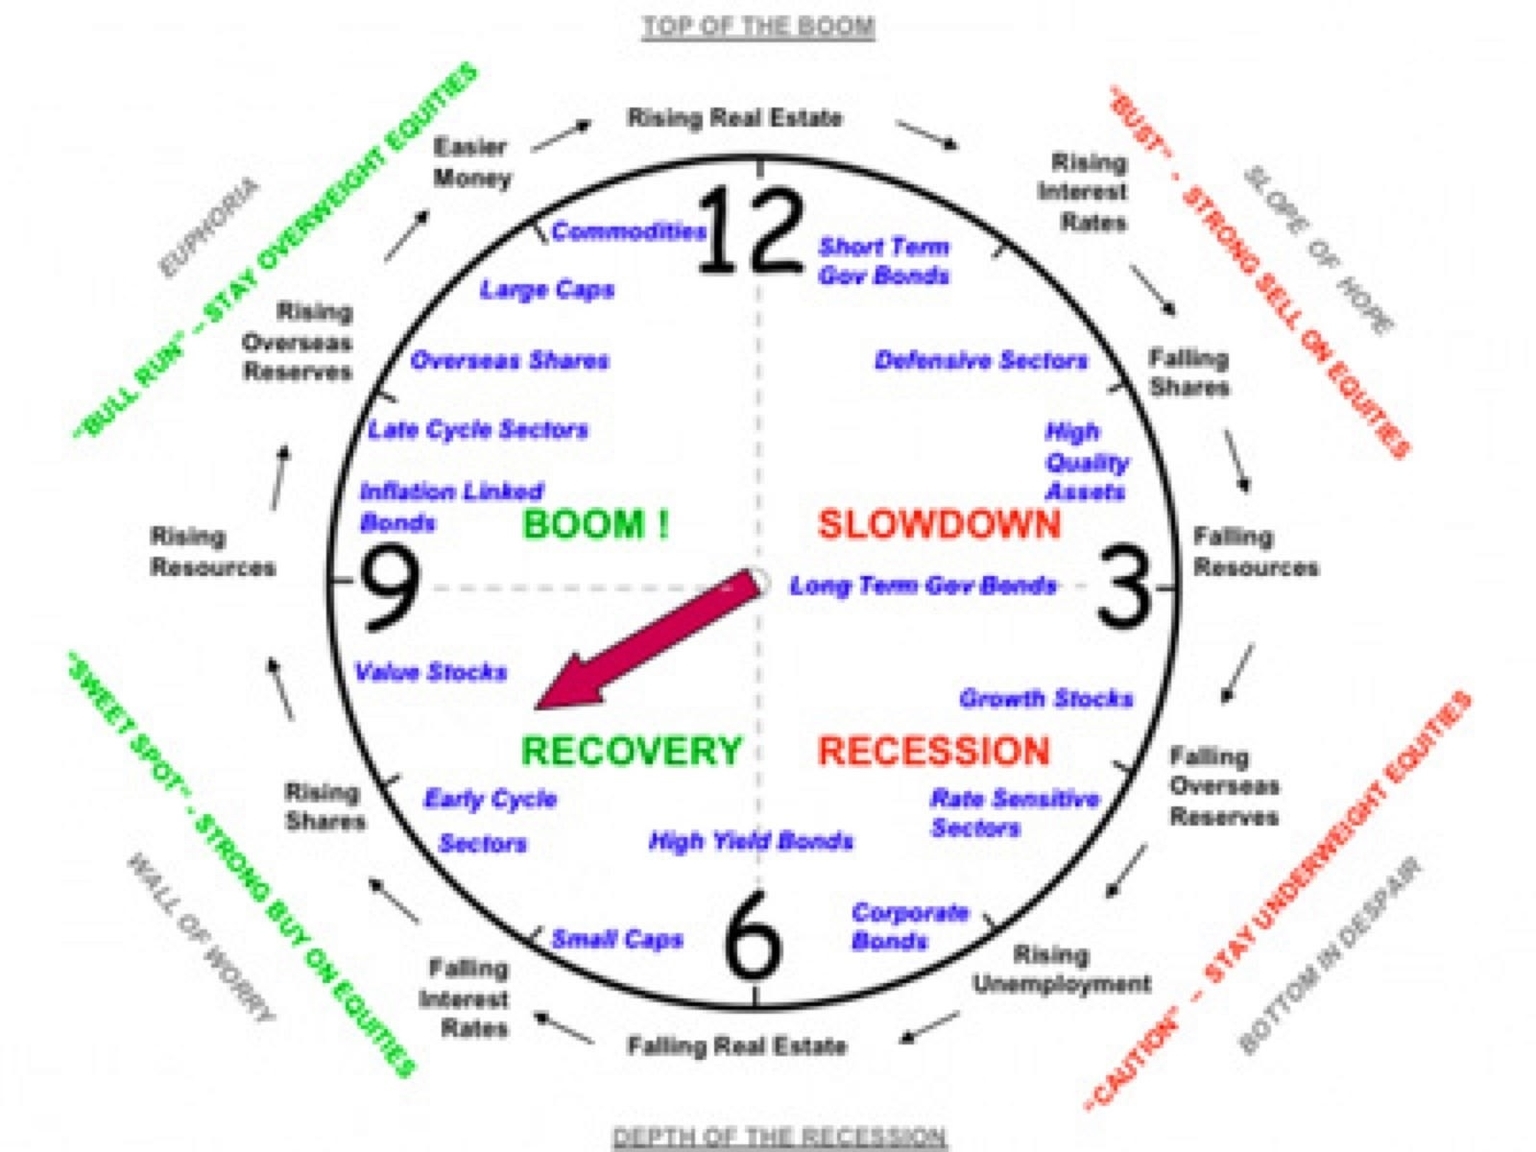
Agriculture Facts

Agriculture is the art and science of cultivating the soil, growing crops, and raising livestock. It includes the preparation of plant and animal products for people to use and their distribution to markets. Agriculture provides most of the world’s food and fabrics. Here are some facts about agriculture in different regions and aspects:

– Canada: Only about 7 per cent of Canada’s land can be farmed. Other marginal (poorer) land can be used to ranch cattle. Aquaculture operations are found on the East and West Coasts and in the Great Lakes. Some crops such as tomatoes, cannabis and flowers are grown in greenhouses in urban centres. Canada is a top exporter of agricultural products in the world, such as canola, beef and maple syrup.
– Farming: Farming began around 10,000 B.C. during the First Agricultural Revolution, when nomadic tribes began to farm. Additionally, this is when the eight so-called “founder crops” of agriculture appeared: 1) emmer wheat, 2) einkorn wheat, 3) hulled barley, 4) peas, 5) lentils, 6) bitter vetch, 7) chickpeas, and 8) flax. The Industrial Revolution led to faster and more efficient farming technology, which helped usher in the Second Agricultural Revolution from 1700 to 1900 in developed countries. The Third Agricultural Revolution, or the Green Revolution, corresponds in the late 20th century with the exponential population growth occurring around the world. It includes biotechnology, genetic engineering, chemical fertilizers, and mass production of agricultural goods.
– Fruit: Fruit farming began sometime between 6000 and

Agriculture Facts

Weather And Climate Venn Diagram

Weather and climate are two concepts that are often confused with each other. While they are related, they are not the same thing. Weather refers to the atmospheric conditions that occur over a short period of time, usually a few hours or days. Climate, on the other hand, is the average weather conditions that occur over a long period of time, typically 30 years or more .

To help you understand the similarities and differences between weather and climate, I found an interactive Venn diagram on the Science Learning Hub website . The diagram shows that while weather and climate are related, they are not the same thing. The diagram also shows that there are some similarities between the two concepts. For example, both weather and climate can be hot or cold, and both can be wet or dry. However, there are also some important differences between the two concepts. For example, weather can change rapidly, while climate changes slowly over time.

The Venn diagram also shows that there are some things that are unique to weather and some things that are unique to climate. For example, weather can vary from day to day, while climate is more stable and changes slowly over time. Weather can also be local, meaning that it only affects a small area, while climate is regional or global, meaning that it affects a larger area. The Venn diagram also shows that there are some things that are common to both weather and climate. For example, both weather and climate can be hot or cold, and both can be wet or dry.

In summary, weather and climate are two related but distinct concepts. Weather refers to the atmospheric conditions that occur over a short period of time, while climate refers to the average weather conditions that occur over a long period of time. While there are some similarities between the two concepts, there are also some important differences. The Venn diagram I found on the Science Learning Hub website is a great tool to help you understand the similarities and differences between weather and climate ..

Weather And Climate Venn Diagram

Stage 4 Cancer

Stage 4 cancer is the most advanced stage of cancer, meaning that cancer has spread from the primary tumor to other parts of the body. This is also called metastatic cancer. Stage 4 cancer is not always terminal, but it usually requires more aggressive treatment and has a lower survival rate than earlier stages. The symptoms, prognosis, and treatment options depend on the type of cancer and where it has metastasized.

Here is a brief overview of stage 4 cancer in about 1000 words:
ymptoms

The symptoms of stage 4 cancer vary depending on the type of cancer and the organs or tissues affected by the metastases. Some common symptoms of metastatic cancer are:

– Shortness of breath, cough, chest pain, or coughing up blood when cancer spreads to the lungs
– Yellowing of the skin (jaundice), abdominal swelling, fluid accumulation (ascites), or pain when cancer spreads to the liver
– Severe back pain, numbness, weakness, fractures, or loss of bowel or bladder control when cancer spreads to the bones
– Headaches, dizziness, nausea, vision or speech problems, confusion, seizures, or trouble walking when cancer spreads to the brain or spinal cord
ome general symptoms of stage 4 cancer are fatigue, weakness, weight loss, loss of appetite, and pain.

Prognosis

The prognosis of stage 4 cancer depends on many factors, such as the type of cancer, the location and number of metastases, the response to treatment, the age and overall health of the person, and the genetic mutations of the cancer cells. Doctors usually use the 5-year survival rate to describe the outlook of stage 4 cancer. This is the percentage of people who live at least 5 years after being diagnosed with cancer. However, these rates are based on data from the past and may not reflect the current advances in treatment and care. Also, survival rates are averages and do not predict the outcome of each individual.

The 5-year survival rate for stage 4 cancer varies widely depending on the type of cancer. For example, according to the American Cancer Society, the 5-year survival rate for stage 4 breast cancer is 28%, for stage 4 prostate cancer is 32%, for stage 4 mesothelioma is

Stage 4 Cancer

Vector Addition Diagram

Vector addition is a fundamental operation in linear algebra that involves adding two or more vectors together to obtain a resultant vector. It is used to describe the motion of objects in space, forces acting on objects, and many other physical phenomena.

Vectors are mathematical objects that have both magnitude and direction. They can be represented graphically as arrows, where the length of the arrow represents the magnitude of the vector and the direction of the arrow represents the direction of the vector. Vector addition is the process of adding two or more vectors together to obtain a new vector that represents the sum of the original vectors.

There are two methods for adding vectors: algebraically and graphically. Algebraic addition involves adding the corresponding components of the vectors together. For example, if we have two vectors A and B, with components (a1, a2, a3) and (b1, b2, b3), respectively, then the sum of the two vectors is (a1+b1, a2+b2, a3+b3). Graphical addition involves placing the tail of one vector at the head of the other vector and drawing the resultant vector from the tail of the first vector to the head of the second vector. The resultant vector is the vector that connects the tail of the first vector to the head of the second vector.

Vector addition has several important properties. First, it is commutative, which means that the order in which the vectors are added does not matter. That is, A + B = B + A. Second, it is associative, which means that the way in which the vectors are grouped does not matter. That is, (A + B) + C = A + (B + C). Finally, it is distributive, which means that scalar multiplication can be distributed over vector addition. That is, a(A + B) = aA + aB, where a is a scalar.

Vector addition is used in many areas of science and engineering. For example, it is used to describe the motion of objects in space, such as the motion of planets around the sun. It is also used to describe the forces acting on objects, such as the forces acting on a bridge or a building.

Vector Addition Diagram

Introduction To Sets & Venn Diagrams

A set is a collection of distinct objects, which can be anything from numbers to colors to people. Sets are usually denoted by capital letters, and their elements are enclosed in curly braces. For example, the set of all even numbers can be written as {2, 4, 6, 8, …}, while the set of primary colors can be written as {red, blue, yellow}.
ets can be combined using various operations, such as union, intersection, and complement. The union of two sets A and B is the set of all elements that belong to either A or B (or both), and is denoted by A ? B. The intersection of two sets A and B is the set of all elements that belong to both A and B, and is denoted by A ? B. The complement of a set A is the set of all elements that do not belong to A, and is denoted by A’.

Venn diagrams are a useful tool for visualizing sets and their relationships. A Venn diagram consists of one or more circles, each representing a set, and the area inside the circle represents the elements of the set. The circles can overlap, and the overlapping region represents the elements that belong to both sets. For example, if we have two sets A and B, we can draw a Venn diagram with two circles, one for A and one for B, and the overlapping region represents the elements that belong to both A and B.

Venn diagrams can be used to illustrate various set operations. For example, the union of two sets A and B can be represented by the entire area inside both circles, while the intersection of A and B can be represented by the overlapping region. The complement of a set A can be represented by the area outside the circle representing A.

Introduction To Sets & Venn Diagrams

Architecture Timeline

Architecture is the art and science of designing and constructing buildings and other structures. Architecture has a long and diverse history, reflecting the culture, technology, and aspirations of different societies and periods. Here is a brief overview of some of the major architectural styles and movements in history, from prehistoric times to the present day.

– Prehistoric architecture (11,600 BCE – 3,500 BCE): The earliest human-made structures, such as earthen mounds, stone circles, megaliths, and cliff dwellings. Examples include Stonehenge in England, Göbekli Tepe in Turkey, and the pyramids of Egypt.
– Ancient architecture (3,500 BCE – 476 CE): The architecture of ancient civilizations, such as Mesopotamia, Egypt, Greece, Rome, India, China, and the Americas. Characterized by monumental temples, palaces, tombs, and civic buildings, often decorated with sculptures, paintings, and reliefs. Examples include the Parthenon in Greece, the Colosseum in Rome, the Great Wall of China, and the Maya city of Tikal.
– Medieval architecture (476 CE – 1400 CE): The architecture of the Middle Ages, influenced by the Roman, Byzantine, Islamic, and Gothic styles. Characterized by the use of arches, vaults, domes, towers, and stained glass windows, often in religious buildings such as churches, cathedrals, and monasteries. Examples include Hagia Sophia in Turkey, Notre Dame in France, the Alhambra in Spain, and Angkor

Architecture Timeline

Chemistry Lab Equipment

Chemistry lab equipment is a collection of tools and instruments used in chemistry experiments and research. These tools are designed to help chemists perform experiments safely and accurately. Here are some of the most common pieces of equipment used in chemistry labs:

1. Beakers: These are cylindrical containers with flat bottoms and a lip for pouring. They are used for mixing, heating, and storing liquids.

2. Erlenmeyer flasks: These are conical-shaped containers with a flat bottom and a narrow neck. They are used for mixing, heating, and storing liquids.

3. Test tubes: These are small cylindrical containers with a rounded bottom and an open top. They are used for holding, mixing, and heating small amounts of liquids.

4. Pipettes: These are small glass or plastic tubes used to transfer small amounts of liquid from one container to another.

5. Burettes: These are long, thin glass tubes with a stopcock at the bottom. They are used to measure and dispense precise amounts of liquid.

6. Graduated cylinders: These are tall, narrow containers with a flat base and a spout for pouring. They are used to measure the volume of liquids.

7. Thermometers: These are instruments used to measure temperature. They are commonly used in chemistry labs to monitor the temperature of liquids during experiments.

8. Hot plates: These are electrically heated plates used to heat substances in the lab. They are commonly used in chemistry labs to heat liquids and solids.

9. Bunsen burners: These are gas burners used to heat substances in the lab. They are commonly used in chemistry labs to heat liquids and solids.

10. Safety goggles: These are protective eyewear worn by chemists to protect their eyes from chemical splashes and other hazards.

These are just a few examples of the many types of equipment used in chemistry labs. Other common pieces of equipment include balances, centrifuges, microscopes, and spectrophotometers.

Chemistry Lab Equipment

Sicentific Revolution

The Scientific Revolution was a period of profound changes in scientific thought and practice that occurred in Europe from the 16th to the 17th centuries. It challenged the traditional views of nature that had been inherited from ancient Greek and Roman authorities, and introduced new methods of observation, experimentation, and reasoning that laid the foundations of modern science. Here is a brief summary of the main features and achievements of the Scientific Revolution in about 1000 words:

The Scientific Revolution began with the publication of Nicolaus Copernicus’s book On the Revolutions of the Heavenly Spheres in 1543, which proposed a heliocentric model of the universe, in contrast to the geocentric model that had been accepted for centuries. Copernicus’s work inspired other astronomers, such as Tycho Brahe, Johannes Kepler, and Galileo Galilei, to observe the heavens with new instruments and techniques, and to discover new phenomena, such as the phases of Venus, the moons of Jupiter, and the elliptical orbits of the planets. These discoveries challenged the prevailing Aristotelian-Ptolemaic system, which assumed that the Earth was at the center of a series of concentric spheres that carried the planets and stars in perfect circles. The Copernican system also had theological implications, as it implied that the Earth was not a special place in God’s creation, but one among many other worlds.

The Scientific Revolution also involved a transformation of the study of nature on Earth, especially in the fields of physics, chemistry, and biology. One of the key figures in this transformation was Isaac Newton, who synthesized the laws of motion and universal gravitation in his monumental work Principia Mathematica, published in 1687. Newton’s physics provided a mathematical framework that could explain the motions of both terrestrial and celestial bodies, and that could be tested by experiments and observations. Newton also contributed to the

Sicentific Revolution

Maths Sets Venn Diagrams

ets are a fundamental concept in mathematics. A set is a collection of distinct objects, called elements. For example, the set of all even numbers is a set that contains the elements 2, 4, 6, 8, and so on. Sets can be defined by listing their elements, or by specifying a rule that determines which elements belong to the set.

Venn diagrams are a tool used to visualize sets and their relationships. They are named after John Venn, a British logician and philosopher who introduced them in the late 19th century. Venn diagrams consist of one or more circles that represent sets. The circles are drawn inside a rectangle that represents the universal set, which is the set of all possible elements.

The elements of a set are represented by points inside the circle that corresponds to the set. For example, if we have two sets A and B, we can represent them using two circles that overlap. The elements that belong to both sets are represented by points inside the overlapping region. The elements that belong to only one of the sets are represented by points inside the non-overlapping regions.

The intersection of two sets A and B is the set of elements that belong to both A and B. It is denoted by A ? B. The union of two sets A and B is the set of elements that belong to either A or B, or both. It is denoted by A ? B. The complement of a set A is the set of elements that do not belong to A. It is denoted by A’.

Venn diagrams can be used to illustrate these concepts. For example, we can draw two circles that overlap to represent two sets A and B. The overlapping region represents the intersection A ? B. The non-overlapping regions represent the sets A’ and B’, respectively. The entire rectangle represents the universal set.

Venn diagrams can also be used to illustrate more complex relationships between sets. For example, we can draw three circles that overlap to represent three sets A, B, and C. The overlapping regions represent the intersections A ? B, A ? C, and B ? C, respectively. The region where all three circles overlap represents the intersection A ? B ?

Maths Sets Venn Diagrams