Research Framework For Agriculture Green Development

Agriculture green development (AGD) is a concept of sustainable development that aims to protect the environment and ecosystems while meeting the economic and social needs of agriculture. AGD is an important pathway for reconciling the conflicts between agricultural production and ecological conservation, as well as enhancing the resilience and adaptation of agriculture to climate change.

To study AGD, researchers need to establish a comprehensive and systematic framework that can measure and evaluate the level of AGD, identify the driving factors and influencing mechanisms of AGD, and propose effective policies and strategies to promote AGD. Based on the literature review, this paper attempts to outline a possible research framework for AGD, which consists of four main components:

– Evaluation system: This component defines the indicators and criteria for assessing the level of AGD, which can reflect the multiple dimensions and objectives of AGD, such as agricultural resource utilization, agricultural environment conditions, agricultural industry development, and farmers’ living standard. The evaluation system can also incorporate the spatial and temporal variations of AGD, as well as the trade-offs and synergies among different indicators.
– Measurement method: This component applies appropriate quantitative methods to calculate the values and scores of the indicators and criteria, and to aggregate them into a comprehensive index of AGD. The measurement method can also compare and rank the AGD level of different regions and provinces, and analyze the trends and patterns of AGD over time. Some examples of measurement methods are entropy-weighted TOPSIS, coupling coordination degree, and green total factor productivity.
– Driving factor analysis: This component identifies and quantifies the main factors that affect the AGD level, and explores the causal relationships and interaction mechanisms among them. The driving factors can be classified into natural, economic, social, technological, institutional, and policy factors, and their impacts can be positive or negative, direct or indirect, short-term or long-term. Some examples of driving factor analysis methods are grey relational degree model, agricultural carbon emissions estimation, and comprehensive indices decomposition.
– Policy implication: This component provides policy suggestions and recommendations to improve the AGD level, based on the results and findings of the previous components. The policy implications can address the specific problems and challenges faced by different regions and provinces, and propose feasible and effective solutions and strategies. The policy implications can also consider the potential benefits and costs of implementing the policies, and the possible feedback and adjustment mechanisms.

The research framework for AGD is a useful tool for understanding and promoting the green and

Research Framework For Agriculture Green Development

Free Body Diagrams

A free body diagram is a graphical representation of an object and the forces that act on it. It is a useful tool for analyzing the forces and moments acting on a body in a given situation. Here is an example of a free body diagram of a book resting on a table:

“`latex
begin{tikzpicture}
node[draw,rectangle,minimum width=2cm,minimum height=1cm] (book) {Book};
node[draw,rectangle,minimum width=4cm,minimum height=0.5cm,below=0.5cm of book] (table) {Table};
draw[->,thick] (book.center) — ++(0,1.5) node[above] {$F_N$};
draw[->,thick] (book.center) — ++(0,-1.5) node[below] {$F_g$};
end{tikzpicture}
“`

The book is represented by a box, and the table is represented by another box below it. The forces acting on the book are the normal force ($F_N$) exerted by the table and the gravitational force ($F_g$) exerted by the earth. The arrows show the direction and relative magnitude of the forces. The length of the arrow is proportional to the magnitude of the force, and the label indicates the type of force.

To draw a free body diagram, one must follow these steps:

Free Body Diagrams

Media Bias Chart (2018)

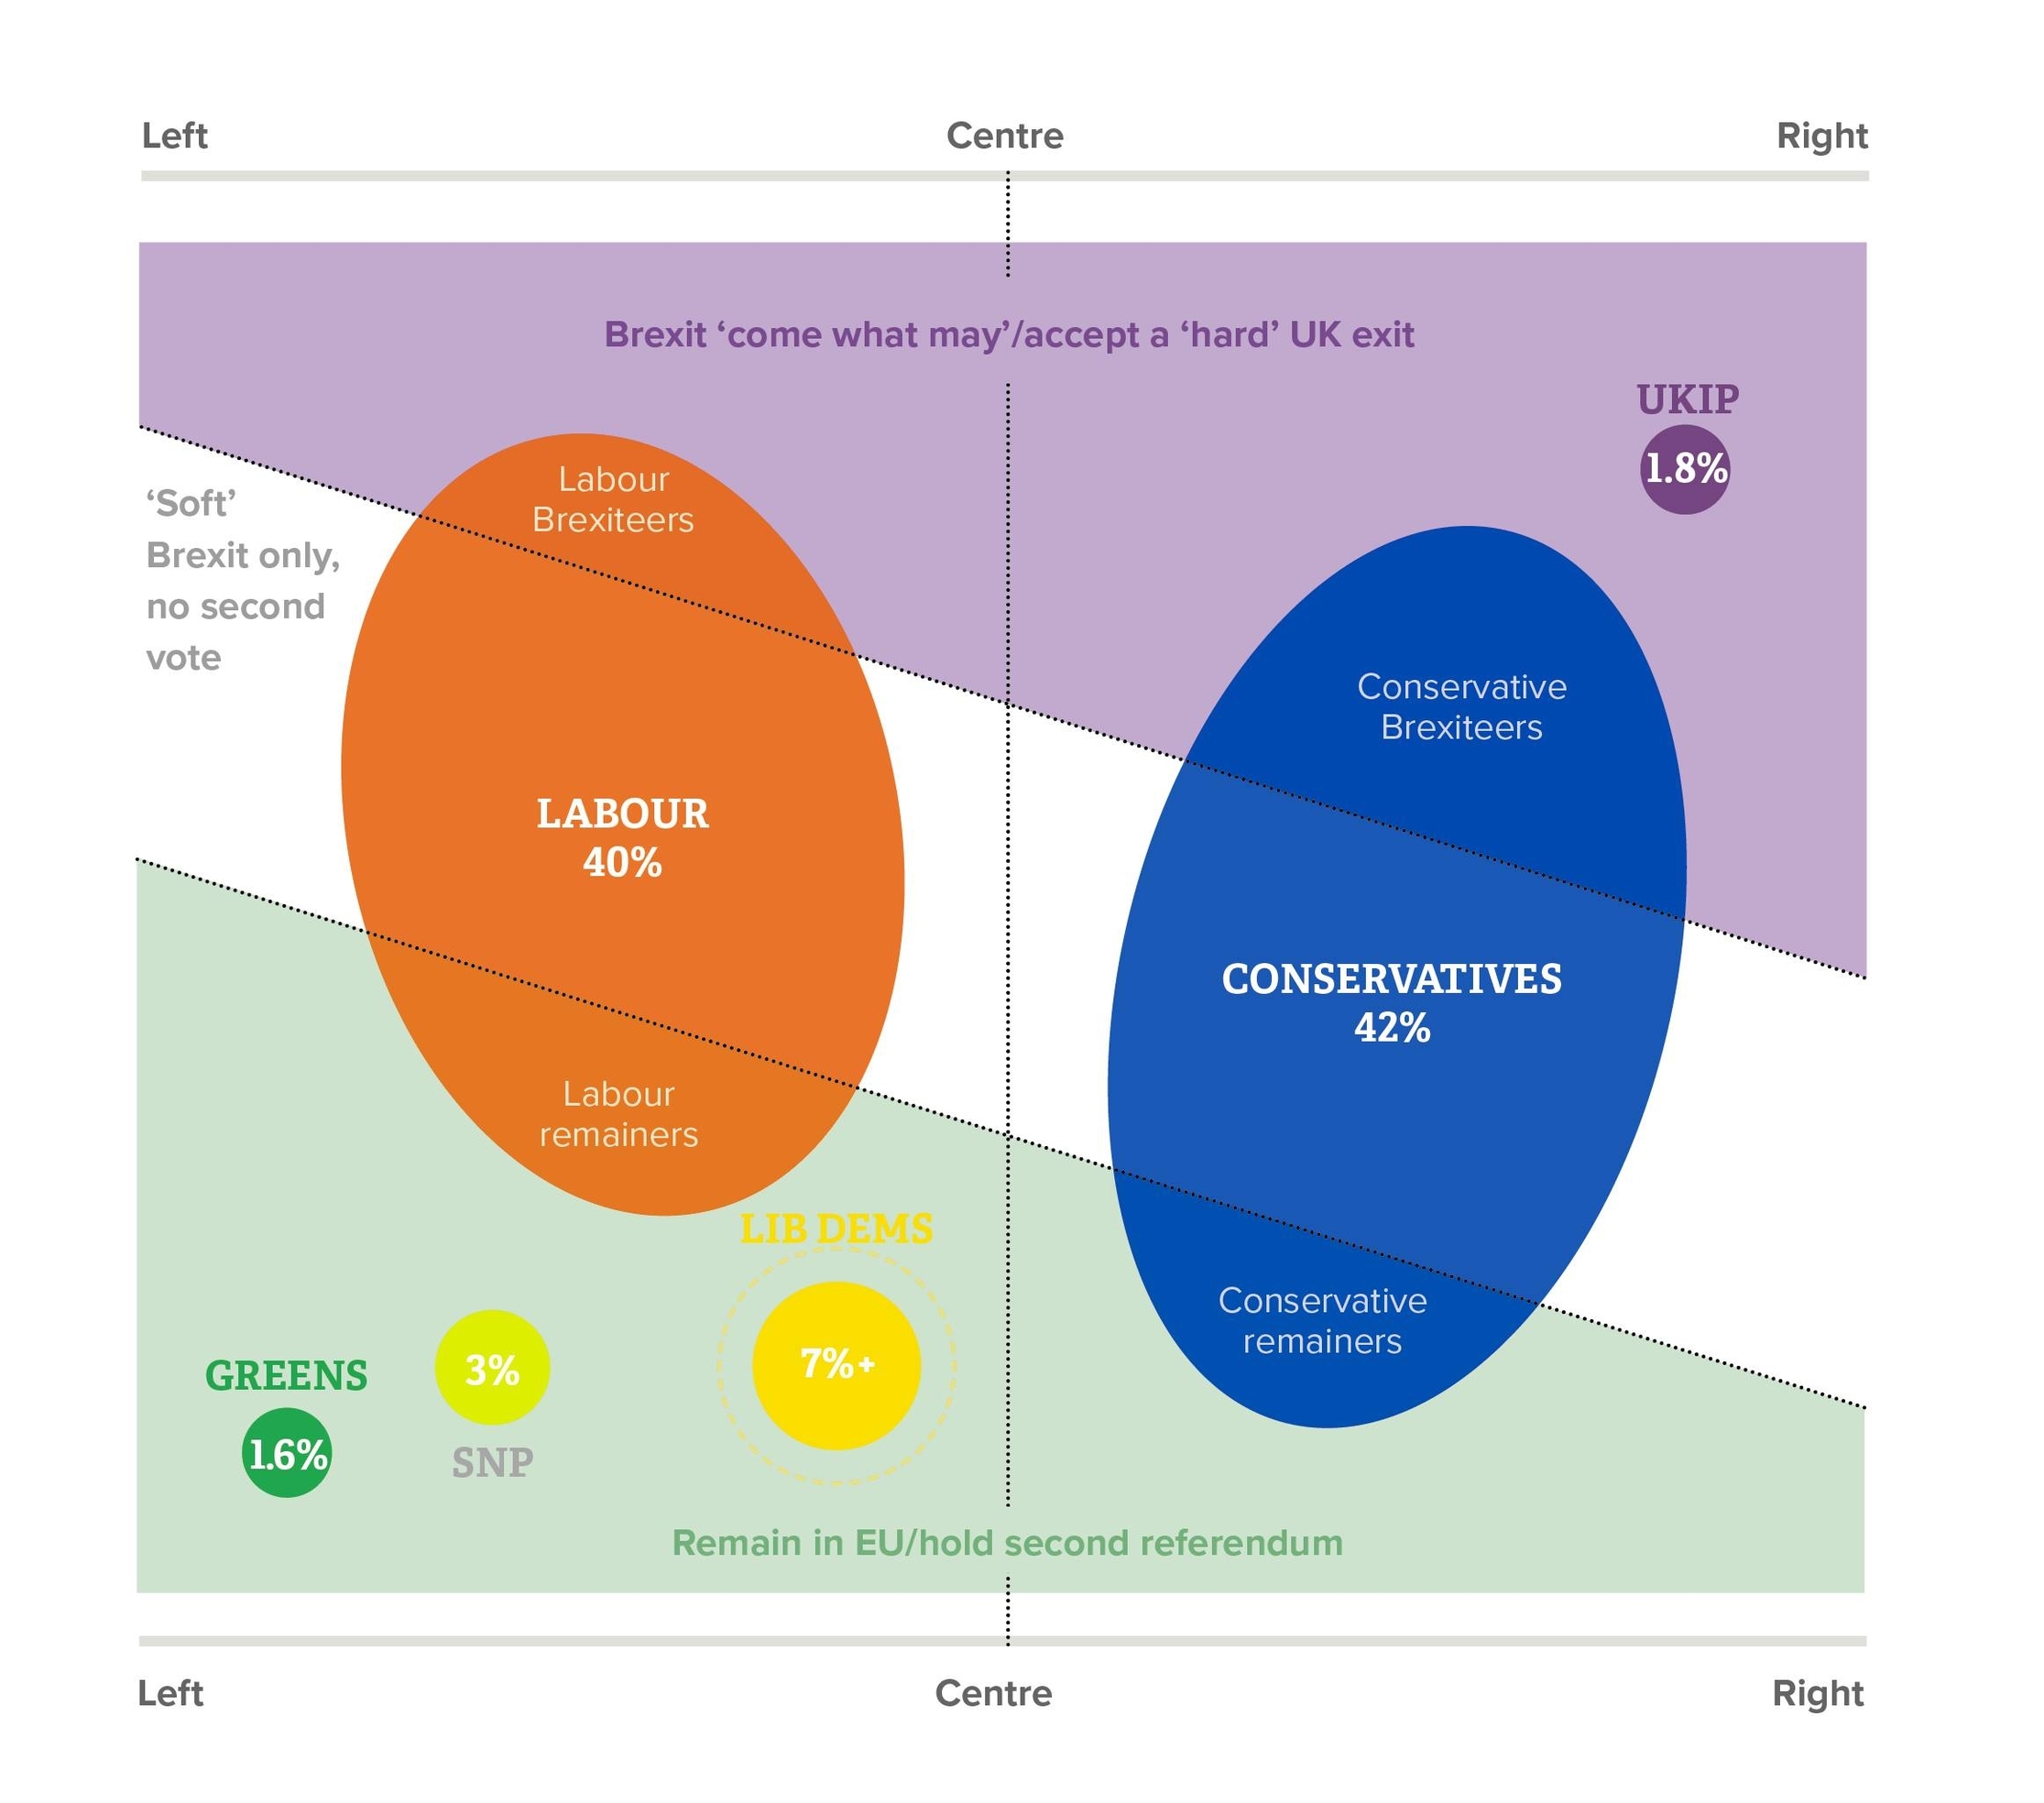
Media Bias (2018): Media bias in 2018 refers to the perceived or actual partiality in news reporting and media coverage. It involves the tendency of media outlets to favor certain viewpoints, political ideologies, or interests, influencing public perception and opinion.

Media Bias Chart (2018)

Why Do Scientists Use Diagrams

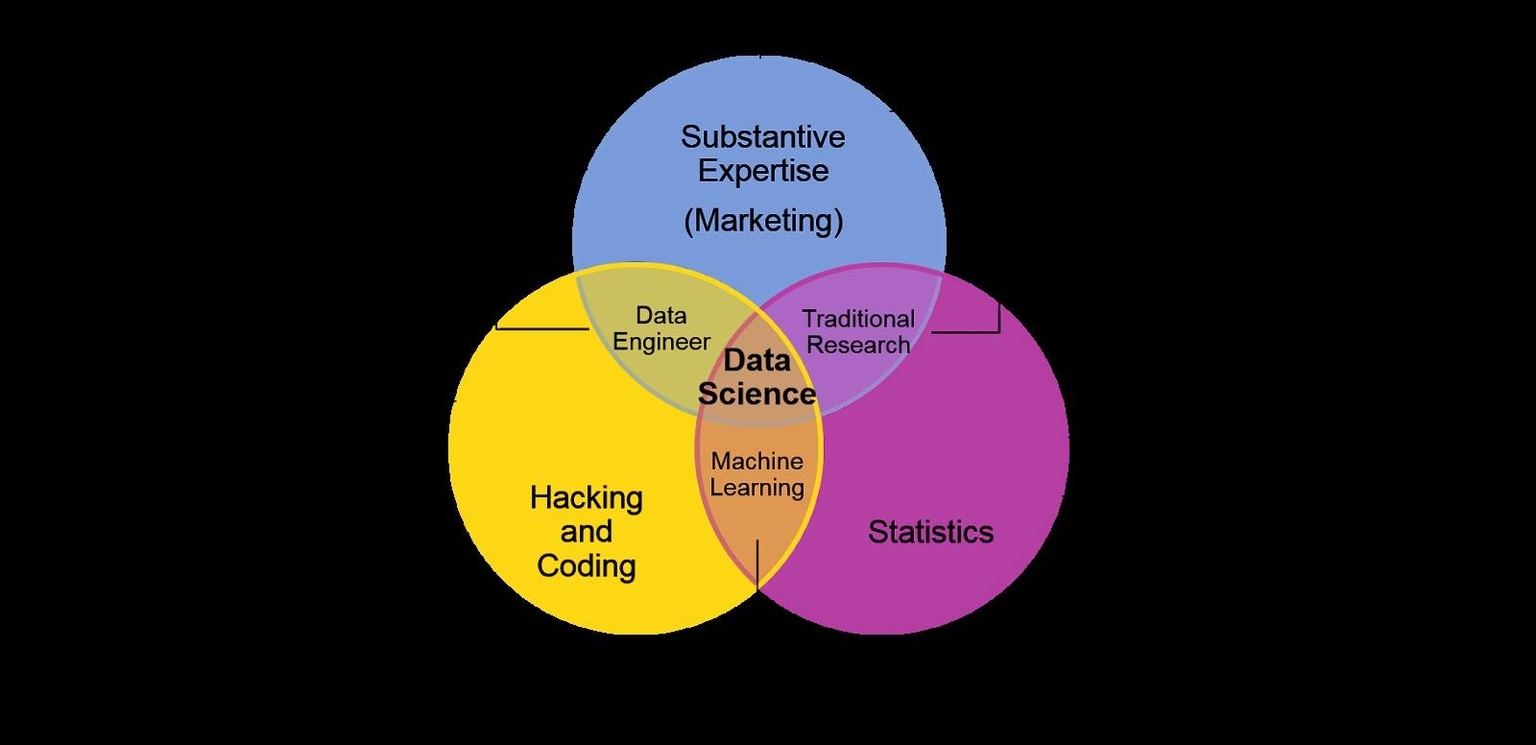
Data Science Venn Diagram Examined: A data science Venn diagram typically shows the intersection of three key areas

Why Do Scientists Use Diagrams

What Is A Math Diagram

Mathematics is a field of study that deals with the logic of shape, quantity, and arrangement. It is a fundamental science that has evolved from basic practices of counting, measuring, and describing the shapes of objects. Mathematics has been an indispensable adjunct to the physical sciences and technology and has assumed a similar role in the life sciences .

Mathematics is a vast subject that encompasses a wide range of topics, including algebra, geometry, calculus, statistics, and more. Mathematicians seek out patterns, formulate new conjectures, and establish truth by rigorous deduction from appropriately chosen axioms and definitions .

The history of mathematics dates back to ancient times, where it was used for practical pursuits such as commerce and agriculture. Over time, mathematics has developed far beyond basic counting, and its growth has been greatest in societies complex enough to sustain these activities and to provide leisure for contemplation and the opportunity to build on the achievements of earlier mathematicians .

All mathematical systems are combinations of sets of axioms and of theorems that can be logically deduced from the axioms. Inquiries into the logical and philosophical basis of mathematics reduce to questions of whether the axioms of a given system ensure its completeness and its consistency .

Mathematics has played a crucial role in the development of modern society. It has contributed to the advancement of science and technology, and has been instrumental in the development of fields such as engineering, physics, and computer science. Mathematics has also been used to solve real-world problems, such as predicting the weather, modeling the spread of diseases, and designing efficient transportation systems .

In conclusion, mathematics is a fundamental science that deals with the logic of shape, quantity, and arrangement. It has played a crucial role in the development of modern society and has contributed to the advancement of science and technology. Mathematics is a vast subject that encompasses a wide range of topics, and its growth has been greatest in societies complex enough to sustain these activities and to provide leisure for contemplation and the opportunity to build on the achievements of earlier mathematicians .

What Is A Math Diagram

Economic Diagrameconomy Diagram

An economy is a complex system of interrelated production, consumption, and exchange activities that ultimately determines how resources are allocated among all the participants. The production, consumption, and distribution of goods and services combine to fulfill the needs of those living and operating within the economy.

There are two main types of economies: market-based and command-based. In a market-based economy, also called a free market economy, goods are produced and distributed in response to demand from consumers. The United States is mostly a market economy. In contrast, command-based economies are regulated by a government body that determines the goods which are produced, their quantities, and the price paid for them. In the modern world, few economies are purely market-based or command-based. Most economies lean toward one or the other of these models.

Economic indicators are used to measure the performance of an economy. These indicators include gross domestic product (GDP), inflation, unemployment rate, and consumer price index (CPI), among others. GDP is the total value of goods and services produced in a country over a specific period of time. Inflation is the rate at which the general level of prices for goods and services is rising, and, subsequently, purchasing power is falling. The unemployment rate is the percentage of the total labor force that is unemployed but actively seeking employment and willing to work. CPI measures the average change in prices over time that consumers pay for a basket of goods and services.

Economies can be further classified into different systems. Capitalism is an economic system in which private individuals or businesses own and operate the means of production and distribution of goods and services. Socialism is an economic system in which the means of production and distribution of goods and services are owned and controlled by the state or the community as a whole. Communism is a form of socialism that advocates for the elimination of private property and the establishment of a classless society.

In conclusion, an economy is a complex system that encompasses all of the activities related to the production, consumption, and trade of goods and services in an entity, whether the entity is a nation or a small town. It is important to understand the different

Economic Diagrameconomy Diagram

Beaver Animal Anatomy Diagram

Beavers are the largest rodents in North America and one of the few species that significantly change their environment. They have stocky bodies with a yellow-brown to almost black coat and a broad, flat, scaly tail. Their large, orange incisors grow continuously throughout their lifetime. Beavers have webbed rear feet and digitated front paws. The beaver’s stocky body enables it to conserve heat.

A beaver’s long, dark-orange, visible incisors grow continuously throughout its life and are worn down through daily use. These teeth are self-sharpening and can cleave a willow the size of a person’s finger in a single bite! If the incisors become too long, they can prevent the beaver’s mouth from closing enough for its grinding molars to meet, which could lead to starvation.

Beavers regularly move between aquatic and terrestrial environments. Their small, dexterous front feet are well adapted to working on land. They walk on five digits, grasp sticks with their front paws and have well-developed digging claws. Their larger hind feet are webbed for swimming and void of fur, except on the dorsal surface. The hind feet also have a preening toe, the second from the inside, with a unique double toenail. Beavers are meticulous groomers. They use the preening toe as a comb to prevent their fine, soft fur from matting to maintain its waterproofing and insulating properties. These flexible toes also remove burrs and parasites.

On land, a beaver’s movements are extremely awkward, making them vulnerable to predators. In water, however, beavers can swim up to 6 mph (10 kilometers per hour). Their oversized lungs allow them to stay submerged for up to 15 minutes while traveling over half a mile. Whiskers help detect objects around a beaver’s face and head, which is especially helpful in narrow passageways and dark water. The beaver’s eyes have a thin,

Beaver Animal Anatomy Diagram

Determinants of Health

Determinants of Health: Determinants of health are factors that influence an individual’s health status. These include biological factors, lifestyle choices, environmental conditions, social and economic factors, and access to healthcare. Understanding these determinants is crucial for developing effective public health policies and interventions.

Determinants of Health

Tree Of Life Diagram

Tree Of Life Diagram: The Tree of Life diagram represents the evolutionary relationships among various species. It shows how different organisms are related through common ancestry and illustrates the diversity of life on Earth.

Tree Of Life Diagram

Meiosis

Meiosis: Meiosis is a type of cell division that reduces the chromosome number by half, resulting in four genetically diverse daughter cells. This process is essential for sexual reproduction and contributes to genetic variation in offspring.

Meiosis