Animal Cell Diagram

Animal Cell Diagram: An animal cell is a eukaryotic structure that contains several key organelles, each with specific functions crucial for the cell’s survival. The nucleus is the control center housing DNA, surrounded by the nuclear envelope. The cytoplasm is the gel-like fluid where all cellular components reside. The endoplasmic reticulum (smooth and rough) aids in the synthesis of lipids and proteins. The Golgi apparatus processes and packages proteins, while mitochondria serve as the cell’s powerhouse. Lysosomes are responsible for breaking down waste materials, and centrioles play a role in cell division. The cell membrane encloses the cell, regulating what enters and exits, and this diagram often labels each part for educational clarity.

Biological Diagrams 91

The Layers of Human Skin

The Layers of Human Skin: The human skin is composed of three primary layers—epidermis, dermis, and hypodermis—each serving unique and vital functions. The outermost layer, the epidermis, provides a waterproof barrier and is responsible for our skin tone. It continuously sheds dead skin cells and regenerates itself. Beneath that lies the dermis, a thicker layer housing nerve endings, hair follicles, sweat glands, and connective tissues that give the skin its elasticity and strength. The innermost layer, the hypodermis (or subcutaneous tissue), consists mainly of fat and connective tissues that insulate the body and act as a cushion to protect internal organs. Understanding these layers helps explain how skin functions as a protective organ and how injuries or diseases impact different levels.

Biological Diagram Online

Psychology vs. Antropology

Psychology vs. Anthropology: Psychology focuses on the study of the human mind and behavior, exploring mental processes, emotions, and cognitive functions. Anthropology, on the other hand, studies human societies, cultures, and their development, examining social structures, traditions, and cultural practices.

Psychology vs. Antropology

Biology Diagrams Sample Of

Biology Diagrams Sample Of: Biology diagrams include detailed illustrations of cellular structures, organ systems, and biological processes. Examples include diagrams of the human heart, plant cells, and the process of photosynthesis, aiding in the understanding of complex biological concepts.

Biology Diagrams Sample Of

Womens Size Chart

Womens Size Chart: A women’s size chart provides a standardized guide for selecting clothing sizes based on body measurements, including bust, waist, and hip dimensions. Sizes may be listed numerically (e.g., 2, 4, 6) or alphabetically (XS, S, M, L, XL), and may also offer specialized categories like petite, tall, or plus sizes. These charts are crucial in ensuring proper fit across various brands and styles, especially in an era where sizing can differ significantly by manufacturer or country.

Women's Size Chart

Animal Cell Anatomy Diagram

Animal Cell Anatomy Diagram: An animal cell anatomy diagram showcases the internal structures and organelles that make up the basic unit of animal life. It usually includes labeled parts such as the nucleus (the control center of the cell), nucleolus, mitochondria (the powerhouse of the cell), endoplasmic reticulum (smooth and rough), Golgi apparatus, lysosomes, ribosomes, and centrosomes. The cell membrane surrounds the cell, regulating what enters and leaves, while the cytoplasm serves as the medium for chemical reactions. This type of diagram is essential in biology education for visualizing and understanding cell function and structure.

Biological Diagrams

Biology Diagrams Examined

Biology Diagrams Examined: Biology diagrams are visual tools that illustrate complex biological processes and structures. They include representations of cellular components, metabolic pathways, and anatomical features, aiding in the understanding and communication of biological concepts.

Biology Diagrams Examined

Economic Growth Diagram

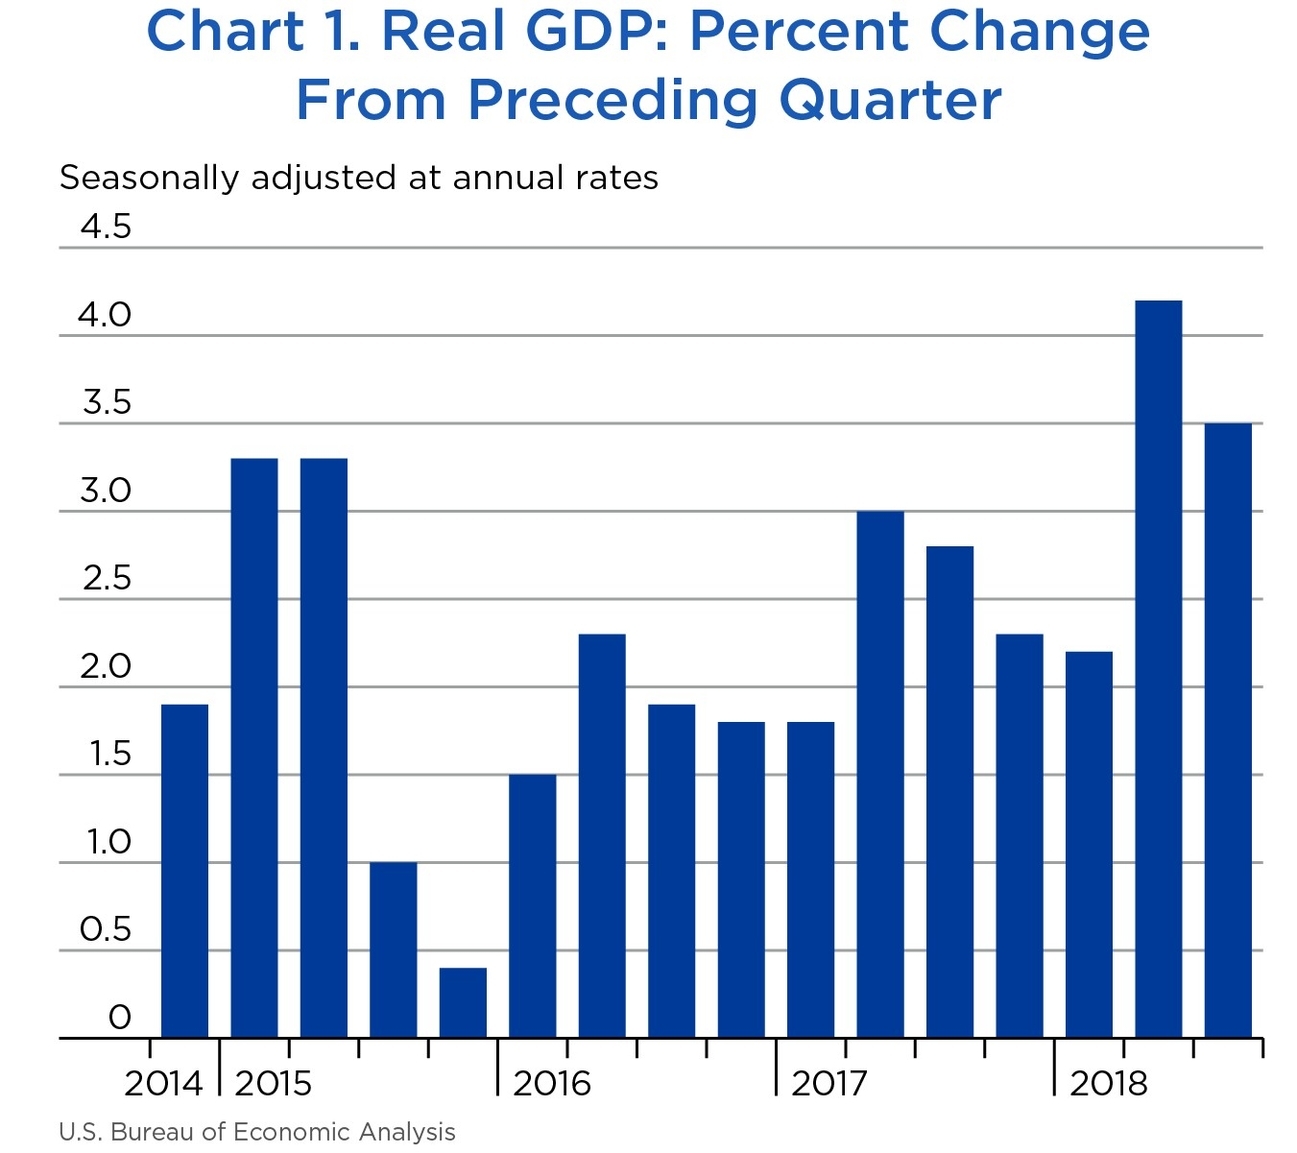
Economic growth is the increase in the production of goods and services in an economy over time. It is commonly measured in terms of the increase in aggregated market value of additional goods and services produced, using estimates such as Gross Domestic Product (GDP) . Economic growth is an important macroeconomic objective because it enables increased living standards, improved tax revenues, and helps to create new jobs .

Economic growth can be achieved through various means, including increases in capital goods, labor force, technology, and human capital . Capital goods refer to physical assets such as machinery, buildings, and infrastructure that are used to produce other goods and services. Labor force refers to the number of people who are employed or seeking employment. Technology refers to the knowledge, tools, and techniques used to produce goods and services. Human capital refers to the knowledge, skills, and abilities of the workforce .

Economic growth can be measured in nominal or real terms. Nominal economic growth is the increase in the production of goods and services in an economy without adjusting for inflation. Real economic growth is the increase in the production of goods and services in an economy after adjusting for inflation .

Economic growth can be divided into four phases: expansion, peak, contraction, and trough . During the expansion phase, employment, income, industrial production, and sales all increase, and there is a rising real GDP. The peak phase is when an economic expansion hits its ceiling. It is in effect a turning point. During the contraction phase, the elements of an expansion all begin to decrease. It becomes a recession when a significant decline in economic activity spreads across the economy. The trough phase is when an economic contraction hits its nadir .

Tax cuts are generally less effective in spurring economic growth than are increases in government spending . If the rewards of economic growth go only to an elite group, then it is unlikely that the growth will be sustainable .

In conclusion, economic growth is the increase in the production of goods and services in an economy over time. It can be achieved through various means, including increases in capital goods, labor force, technology, and human capital. Economic growth is commonly measured in terms of

Economic Growth Diagram

Physical Health Diagram Physical Activity, Good Nutrition

Physical Health Diagram Physical Activity, Good Nutrition: A physical health diagram illustrating physical activity and good nutrition highlights the relationship between exercise, diet, and overall health. It shows how regular physical activity and balanced nutrition contribute to maintaining a healthy body and preventing diseases.

Physical Health Diagram Physical Activity, Good Nutrition

Womens Shoe Size Conversion Chart

Womens Shoe Size Conversion Chart: A women’s shoe size conversion chart helps translate foot sizes across various international systems, such as US, UK, EU, Japan, and Australia. For example, a US size 8 equals a UK size 6 or EU size 39. The chart may also include foot length in centimeters or inches to assist with accuracy, especially when shopping online or purchasing shoes from foreign brands. Proper sizing is essential for comfort, support, and avoiding foot-related health issues, making these charts highly practical for global shoppers.

Women's Shoe Size Conversion Chart