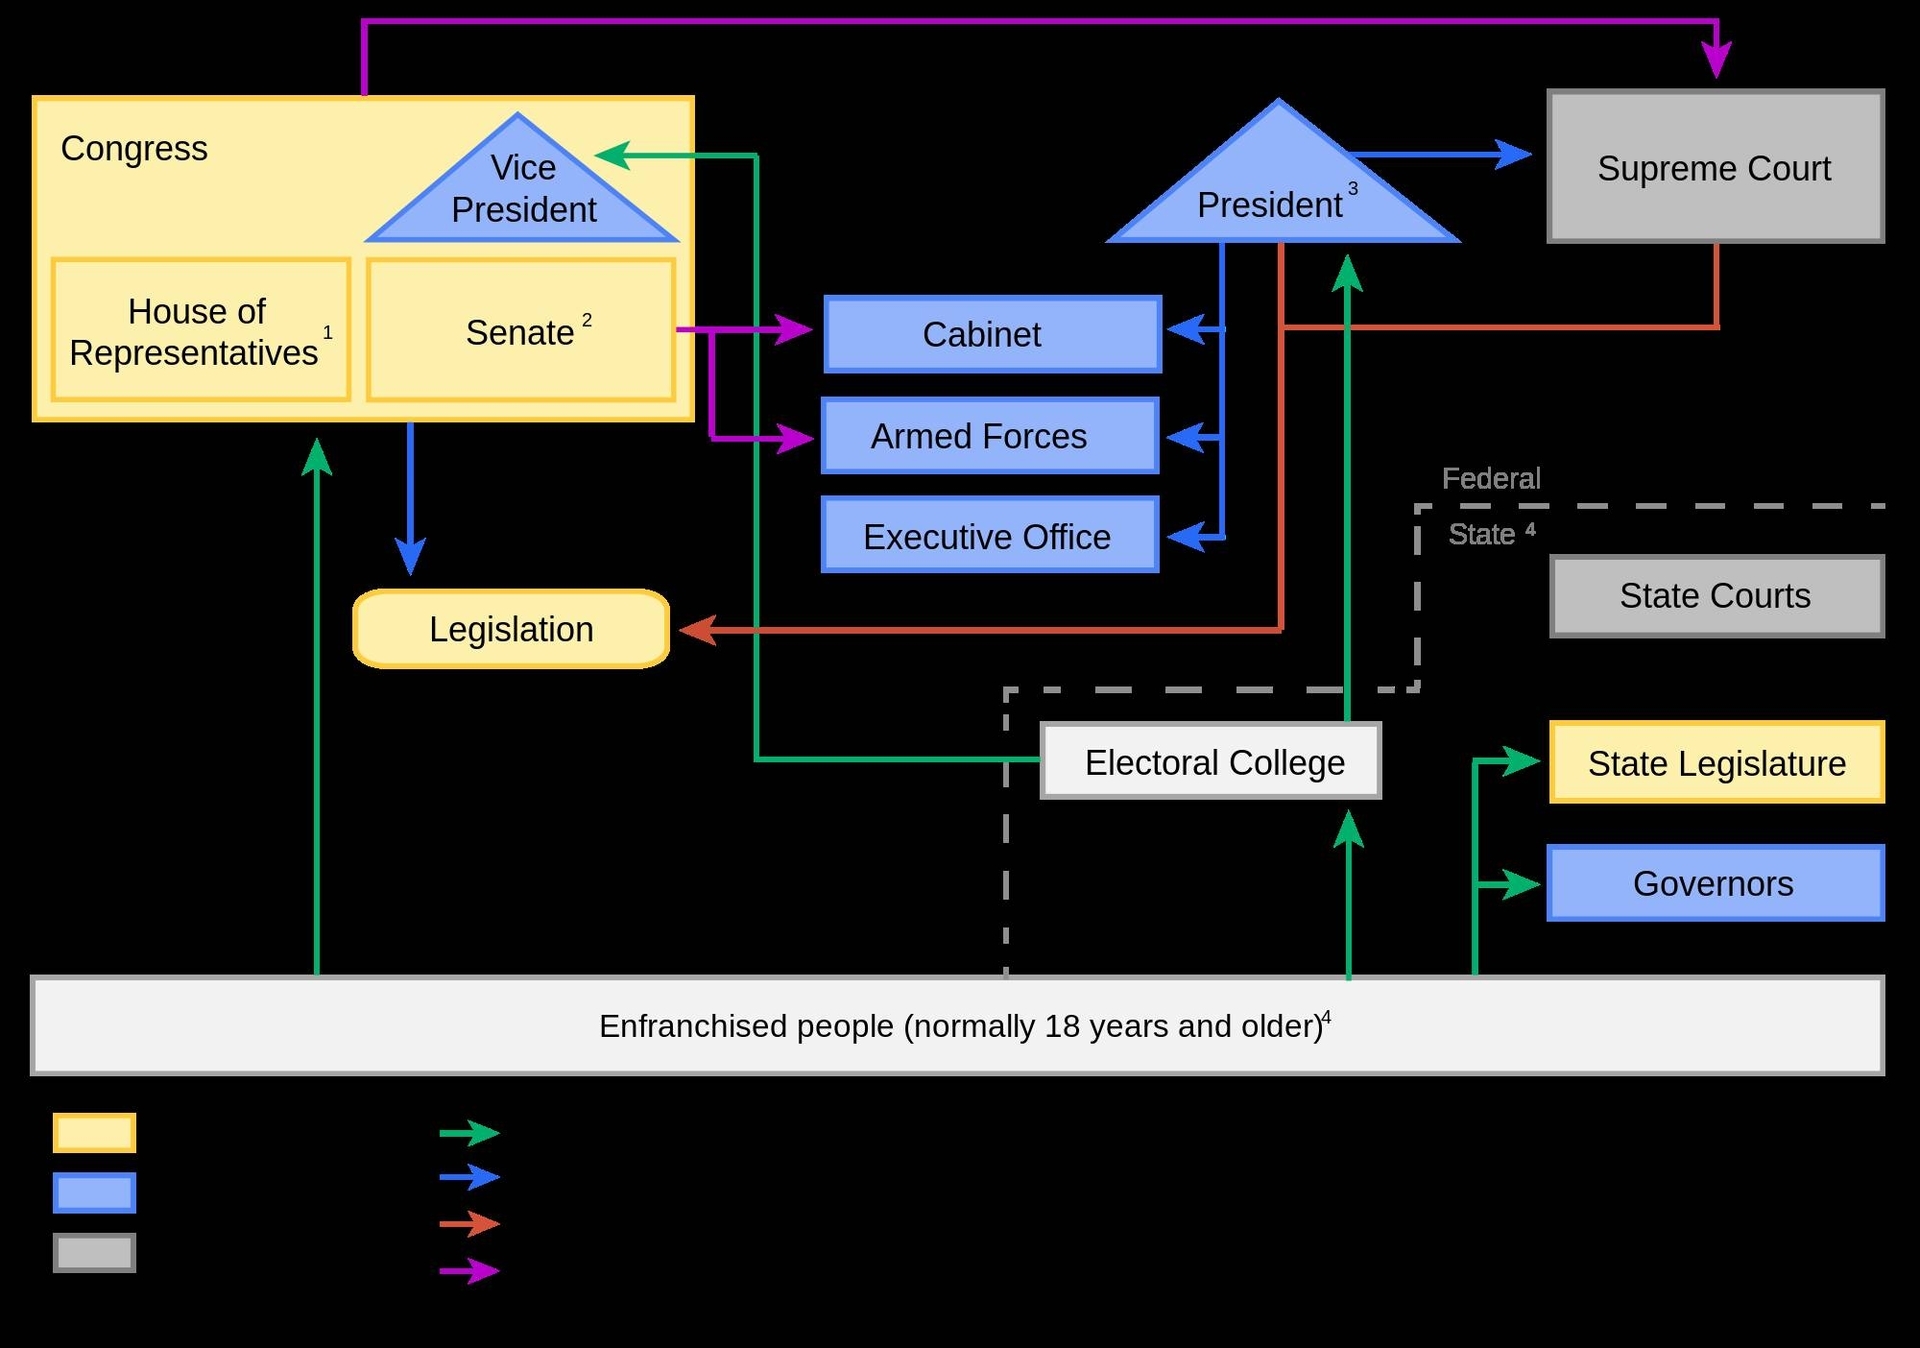
Political System Of The United States: The political system of the United States is a federal republic with a presidential system. It consists of three branches
Charts, Graphs and Diagrams
Political System Of The United States: The political system of the United States is a federal republic with a presidential system. It consists of three branches
Shifting cultivation is a form of agriculture that involves moving from one plot of land to another after a few years of cropping. It is practiced mainly in tropical and subtropical regions, where soil fertility is low and rainfall is unpredictable. Shifting cultivation has both advantages and disadvantages for the environment and the people who practice it. Here is an essay of about 1000 words on shifting cultivation:
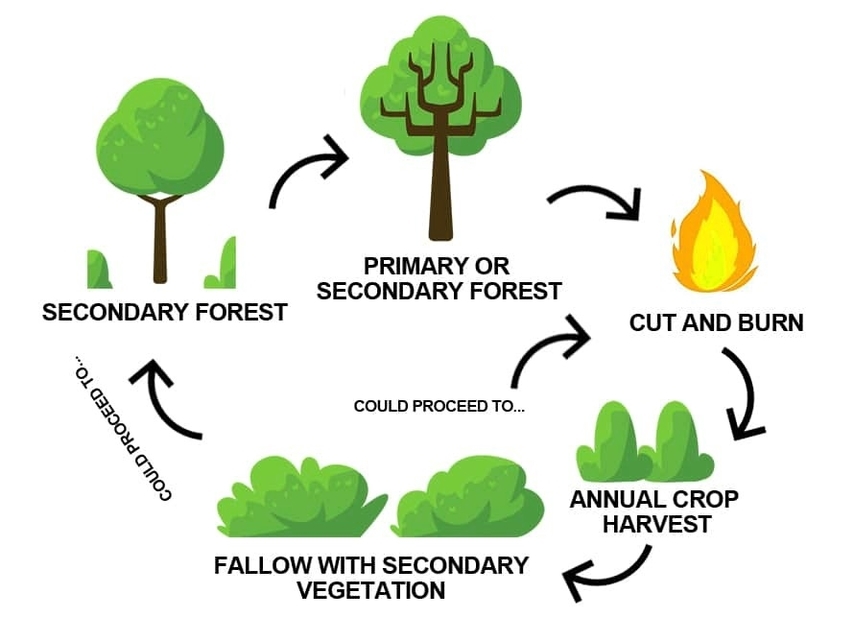
hifting cultivation, also known as slash-and-burn agriculture, is a farming system that has been used for thousands of years by indigenous people in many parts of the world. It is based on the principle of rotating crops and fallows, or periods of rest for the land, to maintain soil fertility and prevent pest and disease outbreaks. Shifting cultivation is usually practiced in areas where the natural vegetation is forest or woodland, and where the population density is low.
The process of shifting cultivation involves clearing a patch of land by cutting down the trees and shrubs, and burning them to create ash that enriches the soil. The cleared land, called a swidden, is then planted with crops such as rice, maize, cassava, yams, and vegetables. The crops are harvested for two or three years, until the soil becomes exhausted or the weeds become too difficult to control. The farmers then abandon the swidden and move to a new location, where they repeat the cycle. The old swidden is left to regenerate naturally, and may be reused after a period of time, usually 10 to 20 years, depending on the local conditions.
hifting cultivation has several benefits for the environment and the people who practice it. First, it is a low-input and low-cost system that does not require external inputs such as fertilizers, pesticides, or irrigation. It relies on the natural processes of nutrient cycling and biological diversity to sustain crop production. Second, it is a flexible and adaptive system that can cope with the variability and uncertainty of the climate and the soil. It allows the farmers to adjust the size, location, and duration of their swiddens according to the availability of land and water, and the demand for food. Third, it is a system that preserves and enhances the biodiversity of the ecosystem. By creating a mosaic of different stages of forest succession, shifting cultivation maintains a high diversity of plant and animal species, and provides habitats and resources for wildlife. Fourth, it is a system that respects and reflects the culture and knowledge of the local people. It is based on the traditional ecological knowledge and practices of the farmers, who have a deep understanding of the local environment and its dynamics. It also supports the social and economic well-being of the farmers, who have access to a variety of food and non-food products from their swiddens and fallows,

Smart farming is a practice in agricultural production that involves using technology like IoT, robotics, drones, and AI, among others, to manage farms, increase output, and reduce environmental impacts. Smart farming is also known as smart agriculture, digital agriculture, or e-agriculture. Here is an essay of approximately 1000 words on smart farming:
“`mart farming: An overview
The world population is expected to reach 8.5 billion by 2030 and 9.7 billion by 2050, according to the United Nations. This poses a huge challenge for the global food system, which needs to increase production by 70% by 2050 to meet the growing demand. However, the current agricultural practices are not sustainable, as they consume large amounts of natural resources, contribute to greenhouse gas emissions, and degrade the environment. Moreover, the agricultural sector faces various risks and uncertainties due to climate change, pests and diseases, market fluctuations, and regulatory pressures.
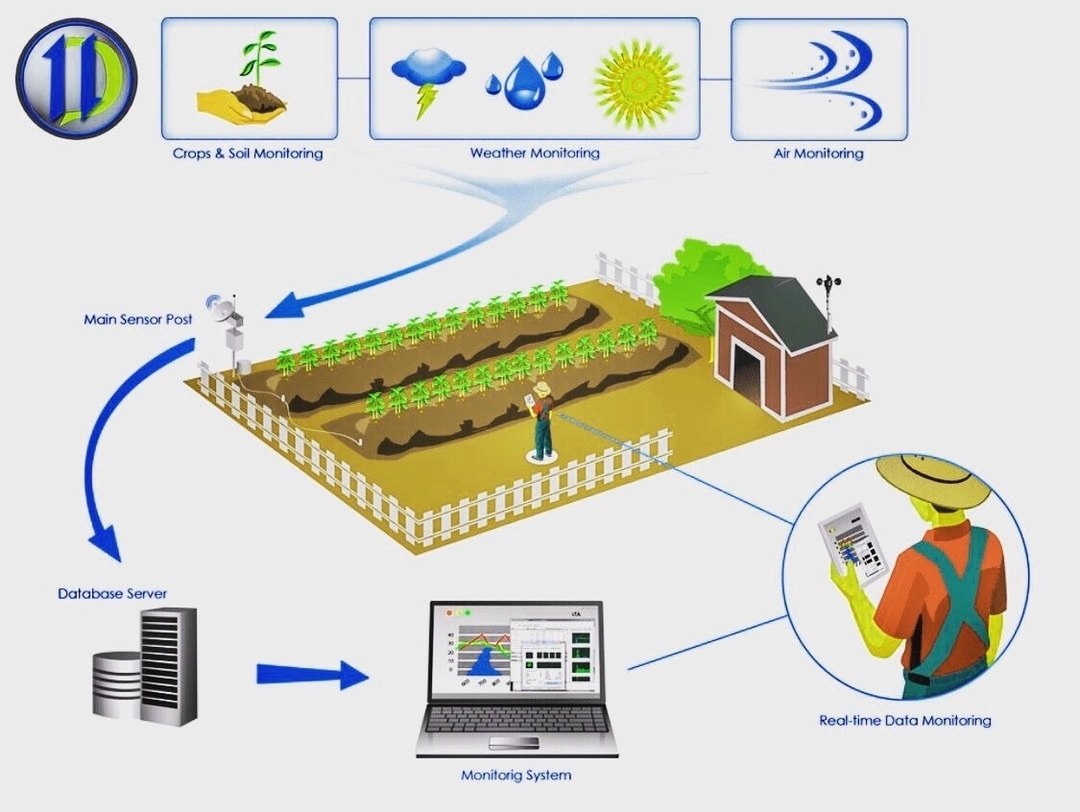
To address these challenges, smart farming has emerged as a promising solution that leverages advanced technologies and data-driven farm operations to optimize and improve sustainability in agricultural production. Smart farming can be defined as the adoption of technologies such as artificial intelligence (AI), automation, the Internet of Things (IoT), drones, robotics, sensors, and cloud computing, among others, to collect, store, analyze, and share electronic data and information in agriculture. Smart farming aims to enhance the efficiency, productivity, profitability, and quality of agricultural products, while minimizing the environmental impacts and resource use.
mart farming can be applied to various aspects of the agricultural value chain, such as crop production, livestock management, aquaculture, forestry, and horticulture. Some examples of smart farming applications are:
– Precision agriculture: This involves the use of GPS, satellite imagery, remote sensing, and soil and crop sensors to monitor the spatial and temporal variability of soil, water, weather, and crop conditions, and to provide site-specific recommendations for inputs such as fertilizers, pesticides, irrigation, and seeds. Precision agriculture can help farmers to
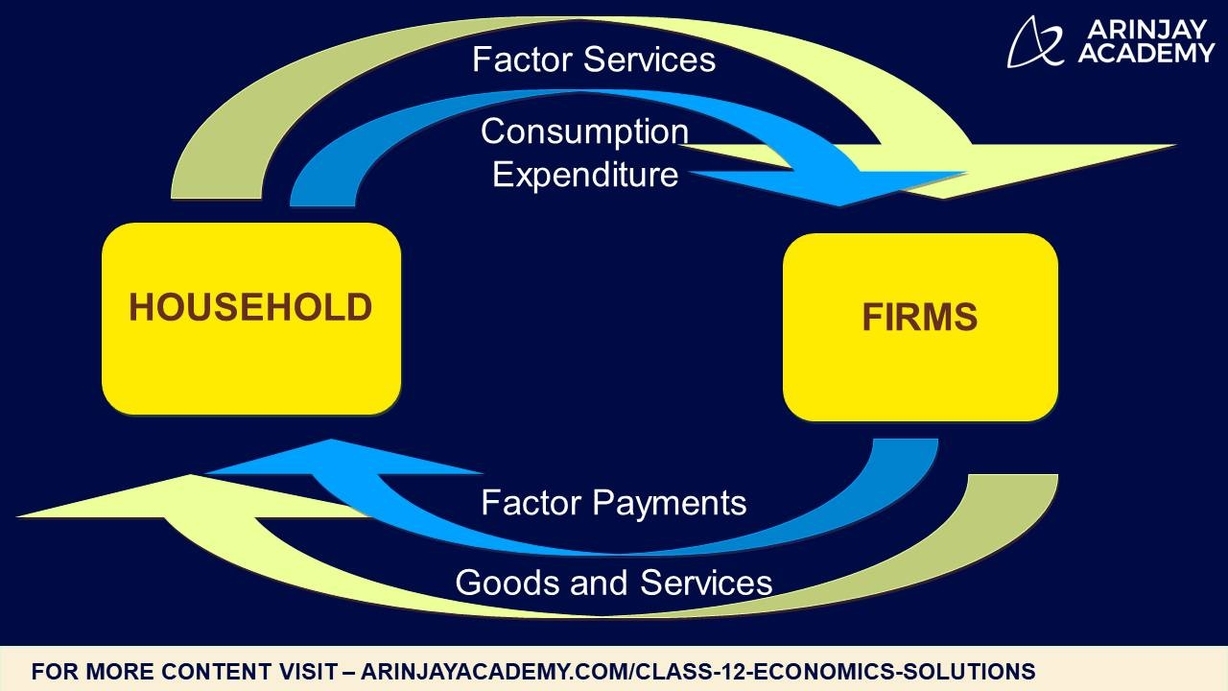
Two Sector Economy: A two-sector economy model divides the economy into two main sectors
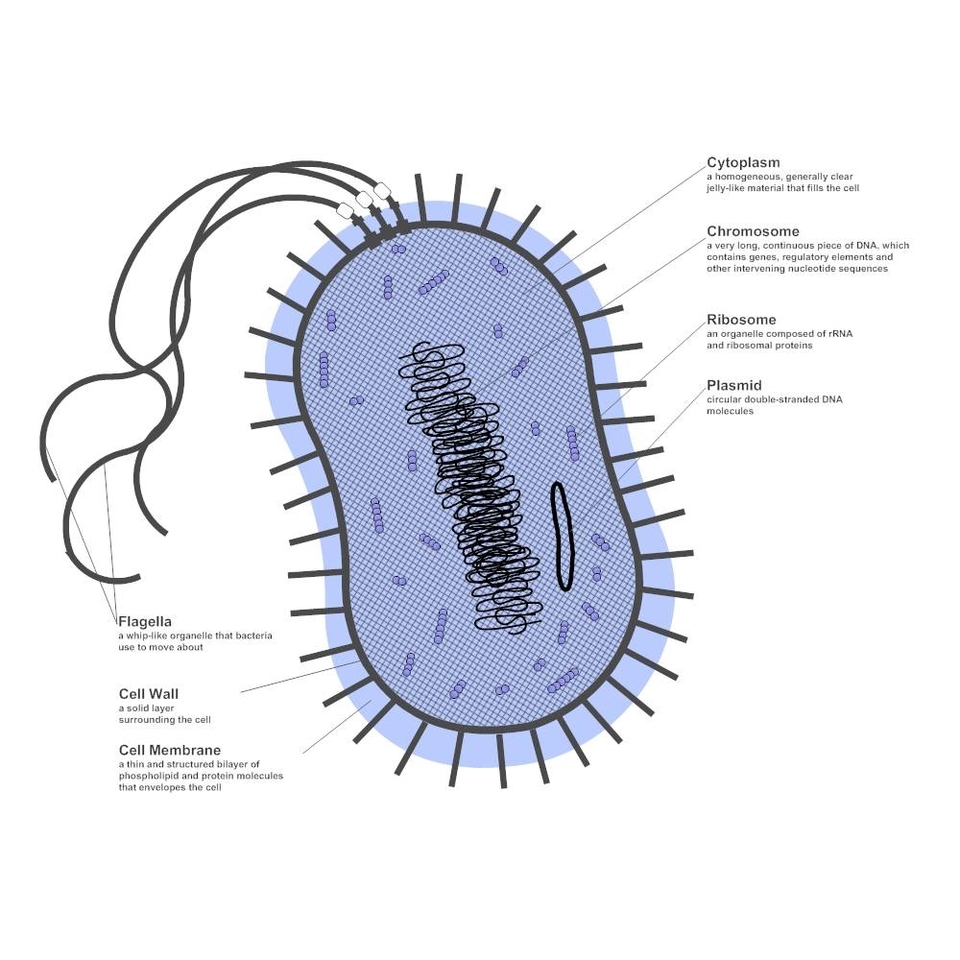
Mesophiles Bacteria Diagram: A mesophiles bacteria diagram illustrates the characteristics and optimal growth conditions of mesophilic bacteria, which thrive at moderate temperatures. These bacteria play significant roles in various ecological and industrial processes.
Computer Science Diagram: A computer science diagram is a visual representation used to illustrate algorithms, processes, or systems within the field of computer science. Common types include flowcharts, state diagrams, and system diagrams, which help in understanding and designing complex systems.
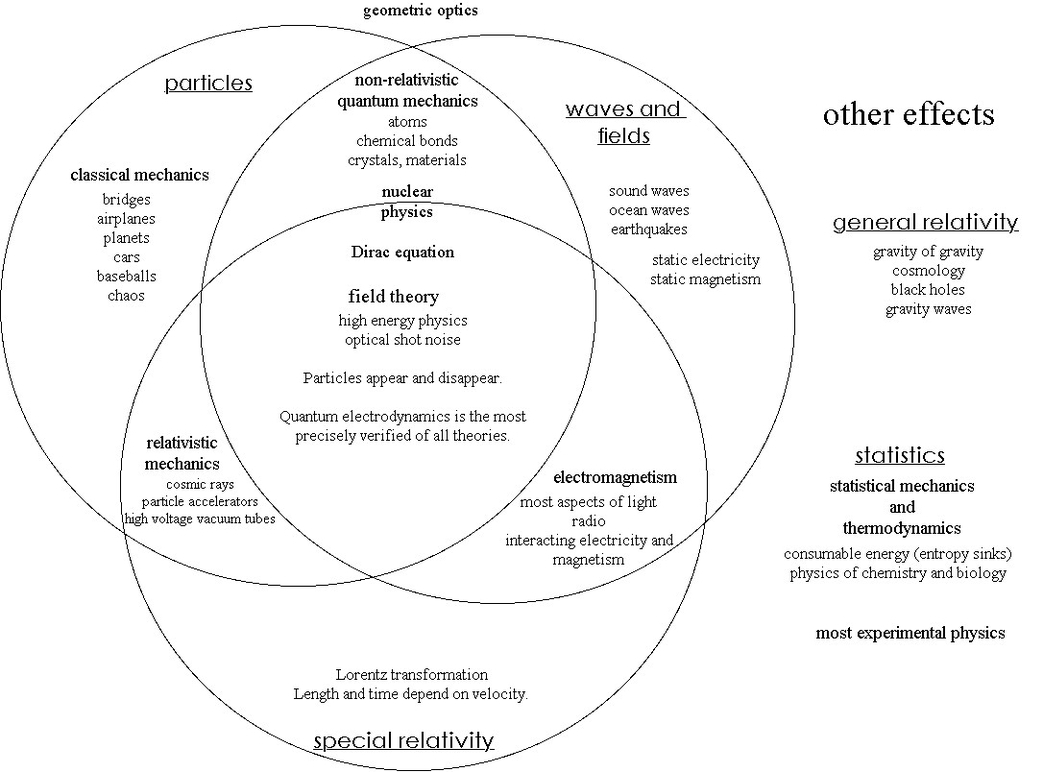
Physics Definition, Branches And Importance: Physics is the study of matter, energy, and the fundamental forces of nature. Its branches include classical mechanics, electromagnetism, thermodynamics, quantum mechanics, and relativity. Physics is essential for understanding the natural world and developing new technologies.

R Venn is a term that refers to the use of R programming language to create Venn diagrams. Venn diagrams are graphical representations of the logical relations between different sets of data. They consist of overlapping circles, where each circle represents a set and the overlapping regions represent the intersections of the sets.
There are several R packages that can help you create Venn diagrams with different features and styles. Some of the most popular ones are:
– ggvenn: This package is a ggplot2 extension that allows you to create Venn diagrams using the grammar of graphics. You can customize the fill color, stroke size, and set name size of each circle. You can also use the ggplot2 functions to add titles, labels, and legends to your plot.
– ggVennDiagram: This package is another ggplot2 extension that maps the fill color of each region to the quantity of the data. This way, you can visually observe the differences between different parts of the Venn diagram. You can also adjust the label size, position, and alpha of each region.
– VennDiagram: This package provides functions to create Venn diagrams with up to five sets. You can specify the area size, cross area size, and category names of each set. You can also change the fill color, line width, line type, and font face of each circle. You can save your Venn diagram as a file or display it directly in R.
– gplots: This package provides a function called venn() that takes a list of sets as input and returns a table of the intersection data. You can use this table to create a Venn diagram with the plot() function. You can also access the intersection data for further analysis.
To use any of these packages, you need to install and load them first. Then, you need to prepare your data as a list of sets, where each set is a vector of values. For example, you can create a list of four sets of genes as follows:
“`r
set.seed(20210110)
genes <-
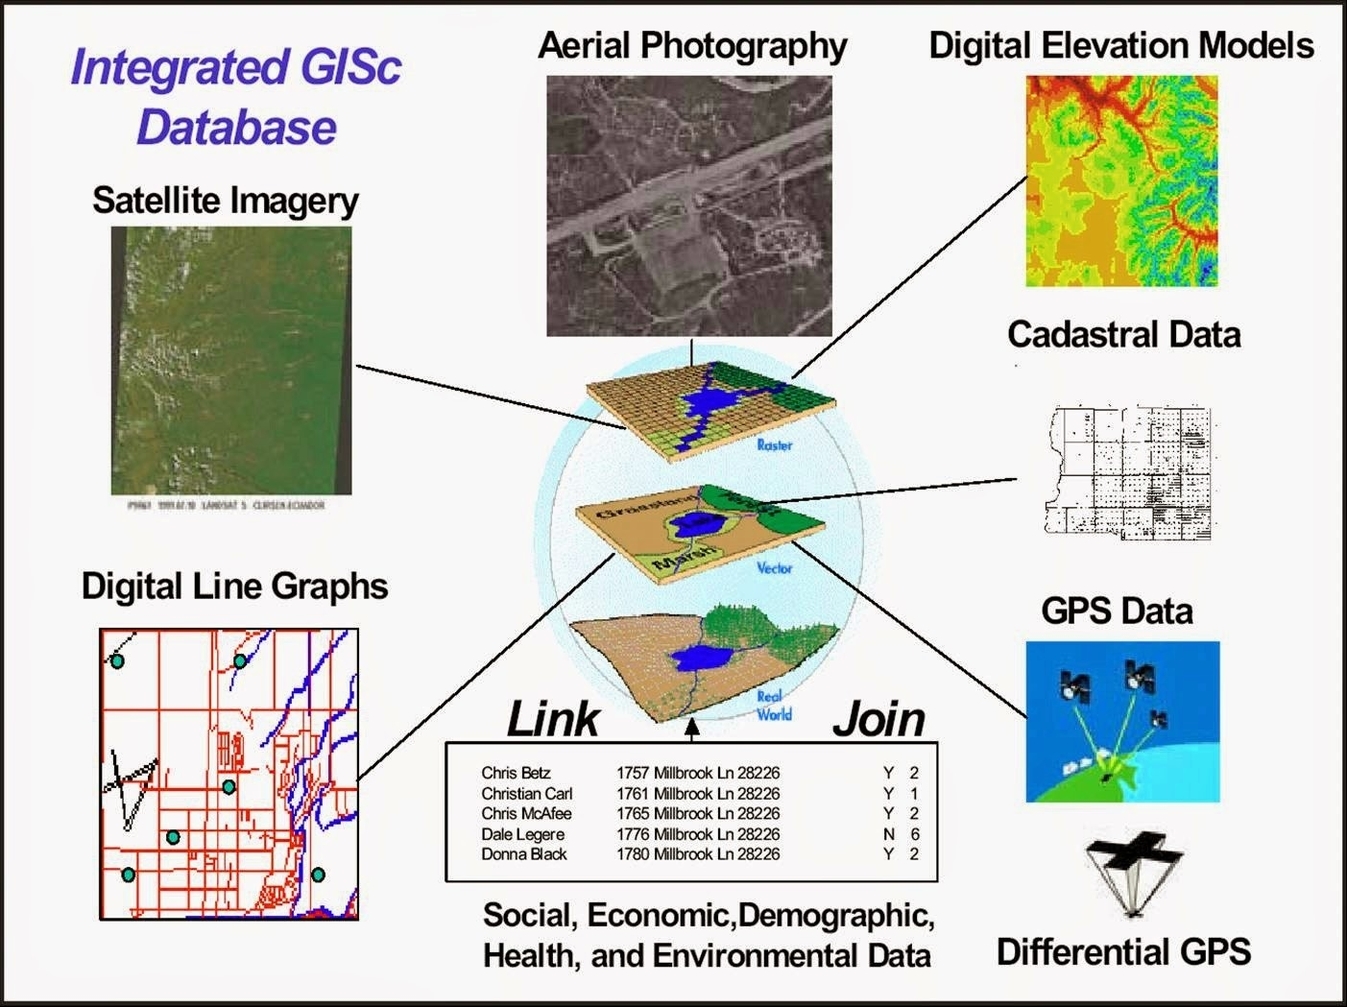
A Geographic Information System (GIS) is a computer system that captures, stores, analyzes, and displays data related to positions on Earth’s surface . GIS can be used to map and examine changes on Earth, and it can show many different kinds of data on one map, such as streets, buildings, and vegetation . This enables people to more easily see, analyze, and understand patterns and relationships . GIS technology is a crucial part of spatial data infrastructure, which the White House defines as “the technology, policies, standards, human resources, and related activities necessary to acquire, process, distribute, use, maintain, and preserve spatial data” .
GIS can use any information that includes location. The location can be expressed in many different ways, such as latitude and longitude, address, or ZIP code . Many different types of information can be compared and contrasted using GIS. The system can include data about people, such as population, income, or education level. It can include information about the landscape, such as the location of streams, different kinds of vegetation, and different kinds of soil. It can include information about the sites of factories, farms, and schools, or storm drains, roads, and electric power lines . With GIS technology, people can compare the locations of different things in order to discover how they relate to each other .
GIS applications include both hardware and software systems. These applications may include cartographic data, photographic data, digital data, or data in spreadsheets . Cartographic data are already in map form, and may include such information as the location of rivers, roads, hills, and valleys . Cartographic data may also include survey data and mapping information that can be directly entered into a GIS . Photographic interpretation is a major part of GIS. Photo interpretation involves analyzing aerial photographs and assessing the features that appear .
In summary, GIS is a powerful tool that allows people to analyze and understand spatial patterns and relationships. It can be used to map and examine changes on Earth, and it can show many different kinds of data on one map. GIS technology is a crucial part of spatial data infrastructure, which is necessary to acquire, process, distribute, use, maintain, and