Operational Excellence – Operational Exc

Operational Excellence – Operational Excellence Diagram – Lean Diagram – Lean Framework for operational excellence. Toyota house diagram shows how the company was able to achieve operational excellence by continious improvement and reaching customer satisfaction through quality, safety, variety, cost and delivery. This is based on employee involvement, standardization and process stability. Source: Operational Excellence https://ygraph.com/chart/2419

Operational Excellence – Operational Exc

Strategy Diagram – Business Strategy Mod

Strategy Diagram – Business Strategy Model – Strategy Diagram – Business Strategy Framework – Enterprise Portfolio Management – EPM. Enterprise Portfolio Management (EPM) is alignment of strategy with operations, business and technology. Source: Enterprise-architecture https://ygraph.com/chart/1735

Strategy Diagram – Business Strategy Mod

Strategy Framework. Business model stra

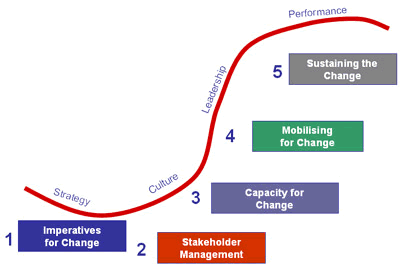
Strategy Framework. Business model strategy. Strategy, culture, leadership, performance model: imperatives for change, stakeholder management, capacity for change, mobilising for change, sustaining the change. Strategy framework. Business model. Source: Sqaki https://ygraph.com/chart/1736

Strategy Framework. Business model stra

Bank Loan – Personal Loan – Bank Loan Ch

Bank Loan – Personal Loan – Bank Loan Chart – Business Loan Chart – Bank Loan Diagram – Bank Loan Graph – Loan Infographic. Reasons for taking loan. Reasons for borrowing money from a bank. Why borrow money from a bank? Debt Consolidation, business use, home improvement, education, auto and vehicle purchase, other uses for personal debt and lines of credit. Line of credit chart. Source: Business Insider bank loan

Bank Loan – Personal Loan – Bank Loan Ch

Customer Service – Customer Service Mode

Customer Service – Customer Service Model – Customer Satisfaction – Customer Service Diagram – Client Service Model – Client Satisfaction Diagram. ACSI (American Customer Satisfaction Index) Model lists key customer service factors such as perceived value, customer satisfaction, customer loyalty, customer complaints, client expectations. Source: Vovici customer service model

Customer Service – Customer Service Mode

USA Banks – Top Banks US – Top USA Banks

USA Banks – Top Banks US – Top USA Banks – Banks Bonuses – Banks Revenues – Bank Profits – TARP – Citigroup, Goldman Sachs, Merril Lynch, JP Morgan Chase, Citi Group, Morgan Stanley. Top Wall Street Banks Bonuses Graph. Financial institutions. OagStateNy https://ygraph.com/chart/1725

USA Banks – Top Banks US – Top USA Banks

HR Organizational Chart – hr org chart –

HR Organizational Chart – hr org chart – Human Organizational Chart – HR Org diagram Functions. HR Roles and mandates: Director of Human Resources, HR Executive Staff Development, Administration, Payroll, Pensions, Benefits, Employee Relations. Source: Nuigalway https://ygraph.com/chart/1623

HR Organizational Chart – hr org chart –

Profit Framework – Profit Business Model

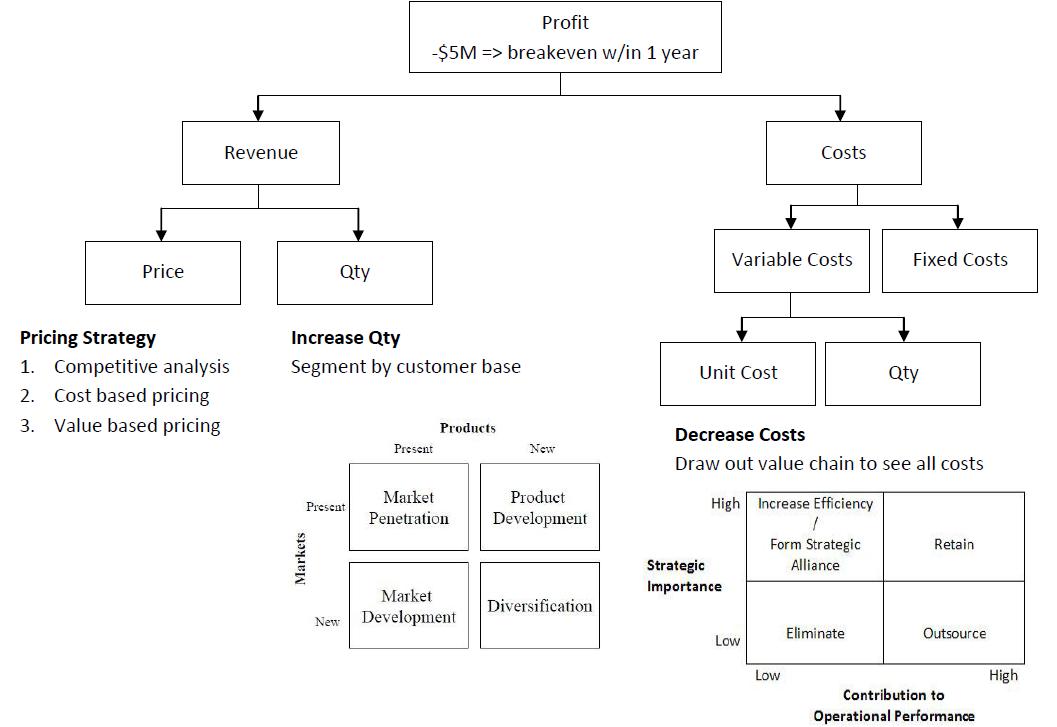
Profit Framework – Profit Business Model – Revenue – Costs = Profit Consulting Framework – Pricing Strategy – Competitive Advantage Model. Competitive Analysis, cost based pricing, value based pricing, segment by customer base; value chain shows costs, increases profit https://ygraph.com/chart/1628

Profit Framework – Profit Business Model