Span of Control – Layers of Control – Or

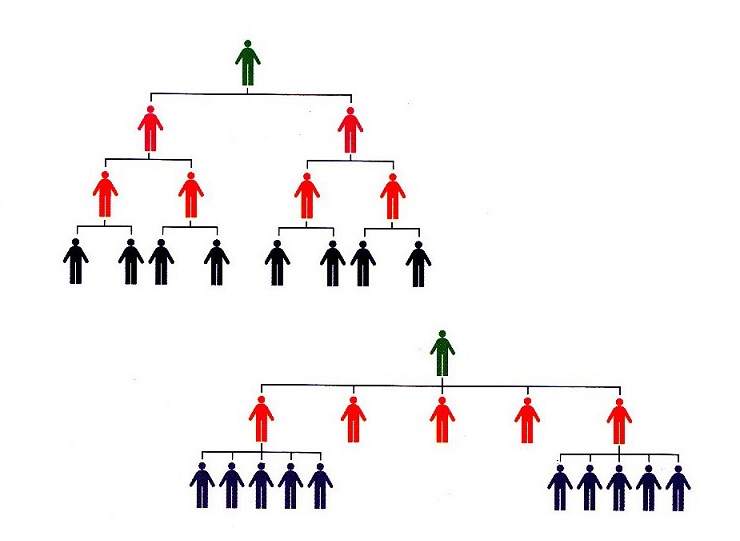
Span of Control – Layers of Control – Organizational Span of Control – Span of Support – Span of Influence – Organizational Hierarchy – Management Control. Span of Control: What resources do I control to get my job done? Source: Igbusinesss span of control

Span of Control – Layers of Control – Or

Performance Management – Performance Man

Performance Management – Performance Management Framework – Performance Management Diagram Model – Busines Performance Management Chart. Planning, performing, evaluating, rewarding. Organizational culture, vision, missions and goals. Source: Boozallen https://ygraph.com/chart/2157

Performance Management – Performance Man

Performance Management Process Diagram.

Performance Management Process Diagram. Management of performance includes the following processes and activities: strategy and objectives, scorecard with key performance indicators (KPI), budget, forecast, monitoring and report, analyze performance. Source: FSN https://ygraph.com/chart/2158

Performance Management Process Diagram.

Key Performance Indicators – KPI Diagram

Key Performance IndicatorsKPI – Key Performance Indicator Diagram – KPI Diagram – Business Strategy KPI Chart – Business Sales KPIs. New business sales and repeat business sales KPI including hard KPI – % of total sales and soft KPI – new offers. Source: Askhow2 https://ygraph.com/chart/2159

Key Performance Indicators – KPI – Key P

Strategy and Key Performance Indicators

Strategy and Key Performance Indicators Diagram. Strategic objectives: Sales Development, Broad Product and Brand Portfolio, Cost Optimization and Efficiency Improvements, Effective Cash Management
KPI: earning per share, volumes, productivity. Source: ImperialTobacco https://ygraph.com/chart/2160

Strategy and Key Performance Indicators

Housing Bubble – Housing Bubble Chart –

Housing Bubble – Housing Bubble Chart – Stages of a Bubble – Bubble Stages – Phases of a Bubble Diagram – Housing Bubble Stages – Housing Prices Bubble Chart – Bubble Diagram. Main Stages of a Bubble including stealth, awareness, mania, blow off. Source: Money-watch https://ygraph.com/chart/2135

Housing Bubble – Housing Bubble Chart –

Span of Control: What resources do you c

Span of Control: What resources do you control to get job done? Span of Accountability: What measures will be used to measure performance. Span of Influence: Who do you interact with and influence to attain goals one is accountable for? Span of Support: How much support can one expect when reaching out to others for help? Source: MyBusinssThoughts https://ygraph.com/chart/2291

Span of Control: What resources do you c

Black Scholes Model – Black Scholes Form

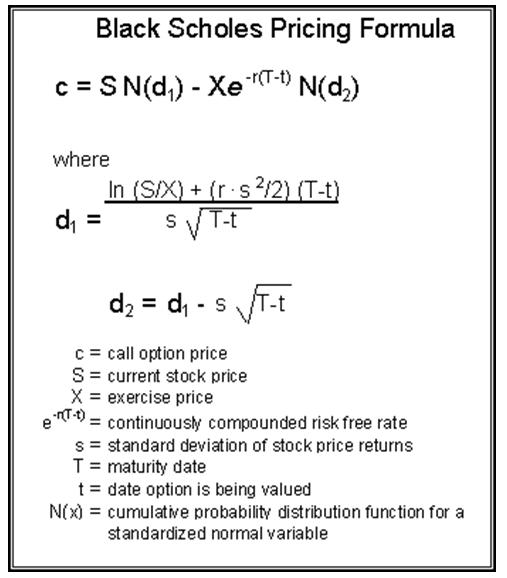
Black Scholes Model – Black Scholes Formula – Black Scholes Diagram – Black Scholes Finance Valuation Model. Finance Diagrams showing Black-Scholes model, formula. Theoretical Option Price with stock price, striking price, time, current rate, volatility. Source: Wiki https://ygraph.com/chart/2144

Black Scholes Model – Black Scholes Form

Consumer Profiling Chart. Consumer Targ

Consumer Profiling Chart. Consumer Targeting Diagram. Marketing Strategy Chart based on Client Personal Information. Coupon Chart. Coupon Saving Infographic. Tracking purchases by retailers diagram. Consumers receive coupon savings, retailers show revenue growth. Tracking Customers increases sales, improves client experience. Customer Tracking Statistics. Coupon Stats. How consumer targeting works? How to target customers? Source: http://www.camcode.com/asset-tags/you-are-not-special-but-your-purchases-are-infographic/ https://ygraph.com/chart/2524

Consumer Profiling Chart. Consumer Targ