Today Mortgage Rates 2011. Home Mortgage Loans. Mortgage Rate Chart. Mortgage Rate Graph. Compare mortgage rates offered by USA loan providers including Nationwide Direct, Josian Whalen, Roundpoint Mortgage, The Money Store. Source: Zillow https://ygraph.com/chart/1304
Category Archives: Business
USA Mortgage Rates Graph. National and
USA Mortgage Rates Graph. National and California rates in 2010, 2 year graph. Current mortgage rates, 2 year trend chart. The rates have gone down over the past years, assuming 30 year fixed mortgage, 20% downpayment and a good credit rating score. Source: Zillow https://ygraph.com/chart/1305
USA Mortgage Rates Graph. National and
Home Equity Loan Trend Graph. Foreclos
Home Equity Loan Trend Graph. Foreclosures caused the percentage of homeowners who owe more than their homes are worth to decline; fewer home-equity loans. Negative net equity means that borrowers paying down their loans. Source: Winterbotham Parham Teeple https://ygraph.com/chart/1309
Home Equity Loan Trend Graph. Foreclos
Home Equity Loan Rates 2011. Home Equi
Home Equity Loan Rates 2011. Home Equity Refinance Mortgage Rates. Home loans for refiancing of your house. The lowest rate home equity loan rate. Average rates are based on zero discount rates. Payment exclude taxes and insurance. Source: Loan•com https://ygraph.com/chart/1308
Home Equity Loan Rates 2011. Home Equi
Auto Insurance Chart. Best car insuranc
Auto Insurance Chart. Best car insurance chart by customer satisfaction. Top automobile insurers. Satisfied auto insurance customers renew more, refer more, switch less. Source: http://www.marketingcharts.com/ https://ygraph.com/chart/1253
Auto Insurance Chart. Best car insuranc
Auto Insurance Rate by Sex (Male, Female
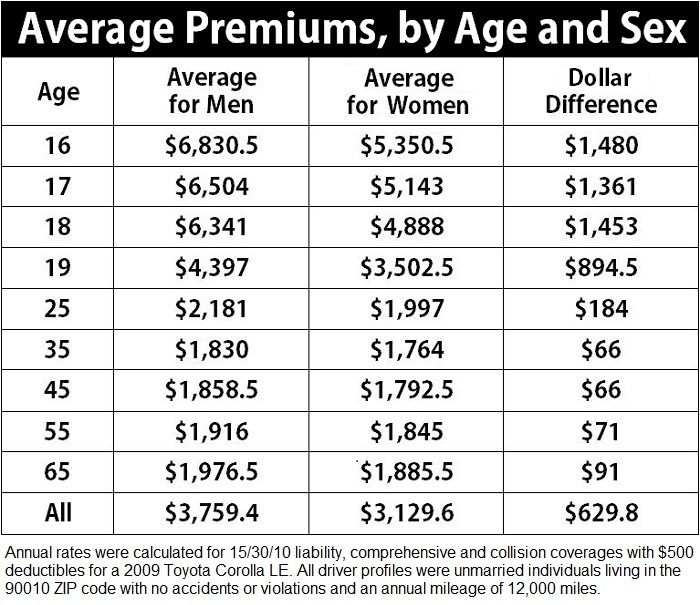
Auto Insurance Rate by Sex (Male, Female) and Age. Car insurance premiums decrease with age and are lower for women than men. Difference in automobile insurance costs. Source: http://www.prweb.com/releases/how-gender-affects-cost/auto-insurance/prweb5243394.htm https://ygraph.com/chart/1255
Auto Insurance Rate by Sex (Male, Female
Loan Chart. Sample loan calculator char
Loan Chart. Sample loan calculator chart. Loan payment amount per month with varying interest rate and loan amount borrowed. Source: http://www.usd.edu/financial-aid/exit-counseling.cfm https://ygraph.com/chart/1257
Loan Chart. Sample loan calculator char
Loan Chart. How a loan is originated.
Loan Chart. How a loan is originated. The loan value chain. Simple flow chart of a loan with a seller, buyer, appraiser, underwriter, originator, capital provider, investing lender. Source: http://www.tracyrealestateblog.com/2009/04/simple-flow-chart-of-loan.html https://ygraph.com/chart/1259
Loan Chart. How a loan is originated.
Tax Chart. Tax rate chart. Tax rate v
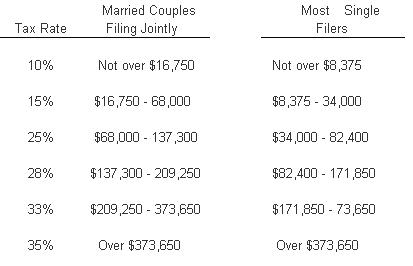
Tax Chart. Tax rate chart. Tax rate varies with income levels 2010, 2011. Tax policy. Source: http://www.investorsolutions.com/news/570/106/Tax-Policy–What-Will-It-Look-Like-in-the-Future/ tax chart
Tax Chart. Tax rate chart. Tax rate v
Tax Rate Chart 2011. Income tax bracket
Tax Rate Chart 2011. Income tax bracket changes for 2011. Source: http://larrymwalkerjr.blogspot.com/2010/07/2011-tax-increase-reality-check.html https://ygraph.com/chart/1275