Chequing Account Comparison Canada Chart. Unlimited Chequing Account Chart. Premium accounts with 6 big banks. CIBC, Bank of Montreal BMO, Royal Bank of Canada (RBC), Bank of Nova Scotia (Scotiabank), TD Canada Trust, National Bank of Canada (NBC). Source: Backnerd chequing account comparison
Category Archives: Business
Online Savings Accounts USA – Online Sav
Online Savings Accounts USA – Online Saving Accounts Rates Comparison Chart 2011. List of highest interest rate savings accounts. Best accounts with highest rates paid for deposits. APY, balance. American Express, Discover, ING, CNB, Ally Bank. Source: BestCashCow online savings accounts chart
Online Savings Accounts USA – Online Sav
Canadian High Interest Savings Account R
Canadian High Interest Savings Account Rates Chart. Savings Accounts Canada – Rates Comparison Chart 2011. List of highest interest rate savings accounts in Canada, including ING, Ally, Canadian Tire, Manulife. Subject to change. Source: HighInterestSavings https://ygraph.com/chart/1356
Canadian High Interest Savings Account R
How to Read a Check – How to read a USA
How to Read a Check – How to read a USA check? Bank check explained. Understanding bank checks: account number, routing number, check number, bank branch. How to read American checks? US bank check. Check numbers. Where to find account number on the check? Source: FAQ Alert how to read a check
How to Read a Check – How to read a USA
Saving Rates Highest USA. Highest savin
Saving Rates Highest USA. Highest saving rates with USA banks. The best savings accounts in United States. American Express, Ally Bank, FNBO Direct, Ultima bank, Washington Savings Bank. Best rates. Source: Money-Rates https://ygraph.com/chart/1316
Saving Rates Highest USA. Highest savin
Best Saving Accounts. Saving rates. Be
Best Saving Accounts. Saving rates. Best saving bank account rates in USA 2011. Today’s best saving rates chart. Interest generated on the saving account in 2011 chart. Best saving rates figures. Source: Emoneycentral. https://ygraph.com/chart/1317
Best Saving Accounts. Saving rates. Be
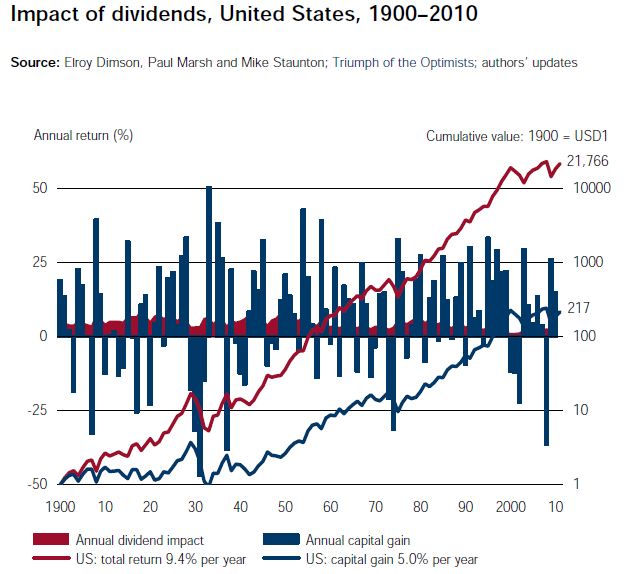
Dividends Chart. Impact of Dividends vs
Dividends Chart. Impact of Dividends vs Capital Gains 1900-2010. Graph showing the impact of annual dividends exceeding the impact of capital gains. Dividends outperform capital gains. Source: http://investingforaliving.wordpress.com/2011/03/27/the-dividend-hammer/ https://ygraph.com/chart/1283
Dividends Chart. Impact of Dividends vs
Today Mortgage Rates 2011. Home Mortgag
Today Mortgage Rates 2011. Home Mortgage Loans. Mortgage Rate Chart. Mortgage Rate Graph. Compare mortgage rates offered by USA loan providers including Nationwide Direct, Josian Whalen, Roundpoint Mortgage, The Money Store. Source: Zillow https://ygraph.com/chart/1304
Today Mortgage Rates 2011. Home Mortgag
USA Mortgage Rates Graph. National and
USA Mortgage Rates Graph. National and California rates in 2010, 2 year graph. Current mortgage rates, 2 year trend chart. The rates have gone down over the past years, assuming 30 year fixed mortgage, 20% downpayment and a good credit rating score. Source: Zillow https://ygraph.com/chart/1305
USA Mortgage Rates Graph. National and
Home Equity Loan Trend Graph. Foreclos
Home Equity Loan Trend Graph. Foreclosures caused the percentage of homeowners who owe more than their homes are worth to decline; fewer home-equity loans. Negative net equity means that borrowers paying down their loans. Source: Winterbotham Parham Teeple https://ygraph.com/chart/1309