Basic Body Diagram: A basic body diagram outlines the major parts of the human body, including the head, torso, arms, and legs. It serves as a foundational reference for studying human anatomy and physiology.

Charts, Graphs and Diagrams
Basic Body Diagram: A basic body diagram outlines the major parts of the human body, including the head, torso, arms, and legs. It serves as a foundational reference for studying human anatomy and physiology.
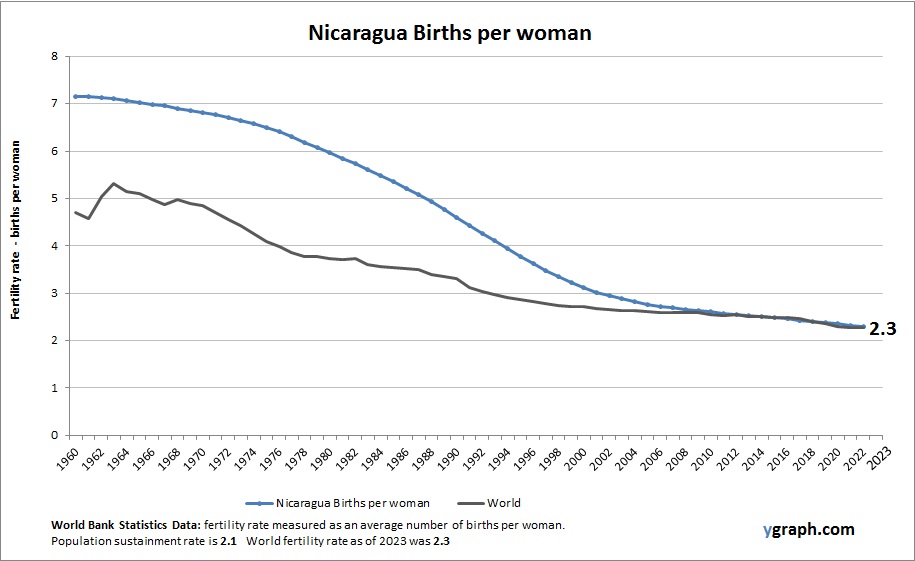
The above graph shows Nicaragua Births per woman. This is according to World Bank birth stats by country. Latest births per woman information for Nicaragua.
Nicaraguas fertility rate has been declining due to increased education and healthcare access, though it remains moderately high. Rural areas maintain higher birth rates compared to urban centers. Population growth continues but at a slower pace, with migration and economic factors influencing demographic trends.
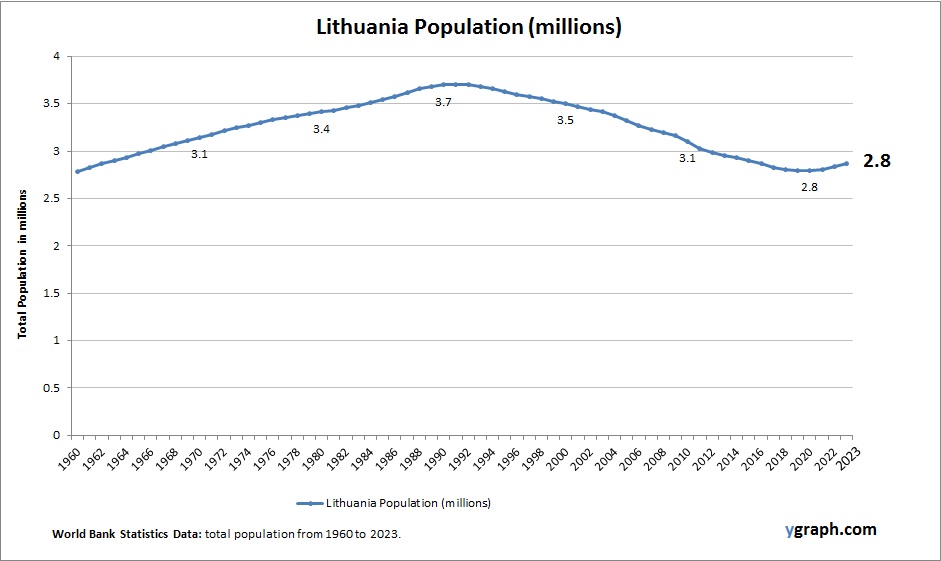
This diagram presents Lithuania Population. The country statistics are compiled by World Bank. Based on the latest available information for Lithuania.
Lithuanias population has been shrinking due to low birth rates and emigration, especially among young adults seeking opportunities in Western Europe. The country faces a rapidly aging population, prompting initiatives to attract returnees and support family growth.
Life Sciences Caps Diagrams Grade 12: Life Sciences CAPS diagrams for Grade 12 cover topics such as genetics, evolution, human physiology, and ecology. These diagrams are essential for understanding complex biological processes and systems.

Diagram Science: Diagram science involves creating visual representations of scientific concepts, processes, and data. These diagrams aid in learning, teaching, and communicating scientific ideas effectively.
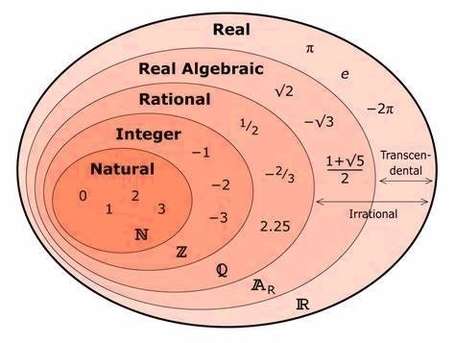
The set of real numbers is the most commonly used number system in mathematics and science. It includes all the numbers that can be represented by a decimal expansion, such as 3.14, -5, 0.333…, or ?2. The set of real numbers can be divided into two subsets: the rational numbers and the irrational numbers. The rational numbers are those that can be written as a ratio of two integers, such as 2/3, -4/5, or 7. The irrational numbers are those that cannot be written as a ratio of two integers, such as ?, e, or ?3. The irrational numbers have non-terminating and non-repeating decimal expansions.
The set of real numbers can be visualized by a number line, which is a horizontal line with a point labeled 0 at the center and equally spaced points to the left and right of 0. Each point on the number line corresponds to a real number, and the distance between any two points is the absolute value of their difference. For example, the distance between 2 and -3 on the number line is |2 – (-3)| = |2 + 3| = |5| = 5. The absolute value of a real number is always non-negative, and it measures how far the number is from 0. For example, the absolute value of -4 is |-4| = 4, which means that -4 is 4 units away from 0 on the number line.
The set of real numbers has many important properties and operations, such as addition, subtraction, multiplication, division, exponentiation, and order. These properties and operations obey certain rules, such as the commutative, associative, and distributive laws, which allow us to manipulate and simplify expressions involving real numbers. The set of real numbers also has special elements, such as 0, 1, and -1, which have unique roles in the operations. For example, 0 is the additive identity, which means that adding 0 to any real number does not change its value. Similarly, 1 is the multiplicative identity, which means that multiplying any real number by 1 does not change its value. And -1 is the additive inverse of 1, which means that adding -1 to 1 gives 0.
The set of real numbers is the foundation of many branches of mathematics, such as algebra, geometry, calculus, and analysis. It is also widely used in modeling and solving real-world problems, such as physics, engineering, economics, and statistics. The set of real numbers is not the only
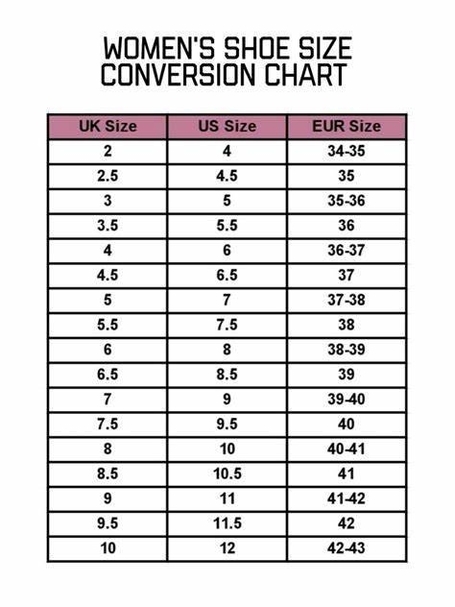
A women’s shoe size conversion chart is an essential tool for navigating the differences between international sizing systems, helping shoppers find the perfect fit regardless of where their shoes are made. Because sizing standards vary between regions such as the United States, United Kingdom, Europe, and Asia, the same foot length can correspond to different numerical sizes. A well-designed chart aligns these systems side by side, often including foot measurements in inches or centimeters to improve accuracy. This is especially useful when shopping online, where trying shoes on is not an option. By referencing a reliable conversion chart, women can confidently select sizes that match their foot length and width, reducing the likelihood of returns and ensuring both comfort and style in their footwear choices.
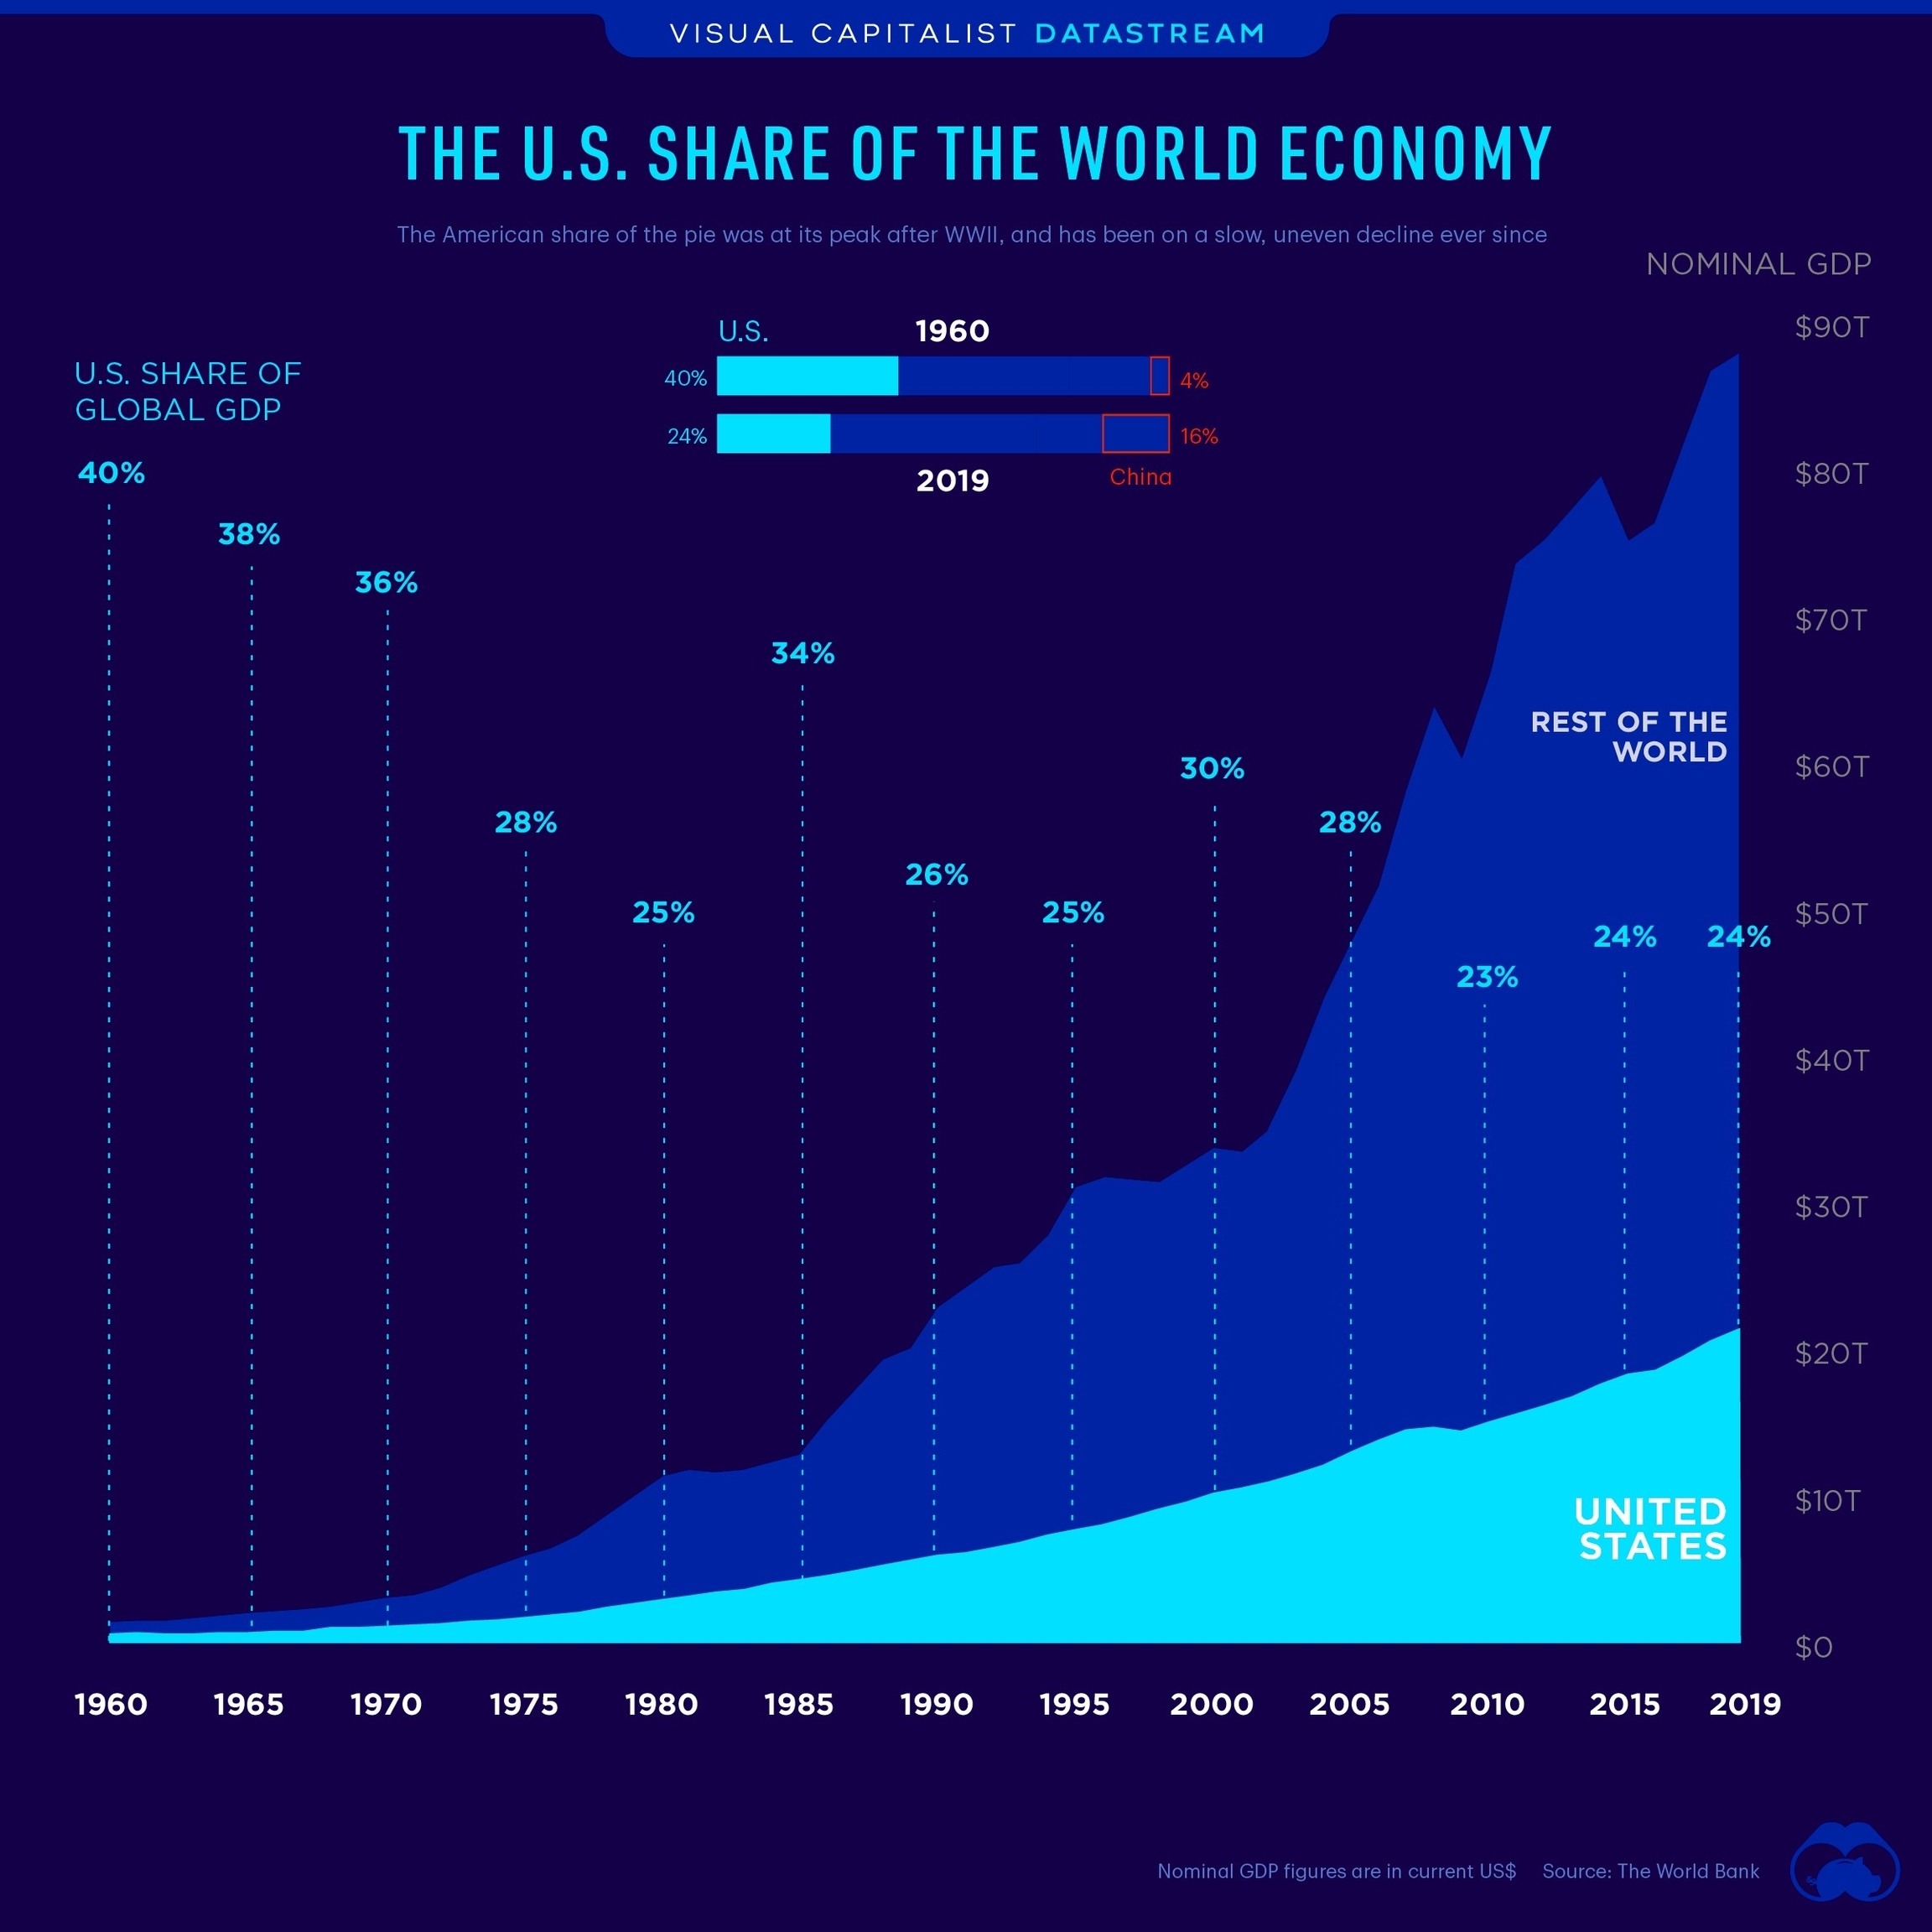
The United States is the world’s largest economy by nominal GDP, with a nominal GDP of $21.4 trillion in 2021, which is about 24% of the global economy . However, the US share of the global economy has been declining over time. In 1960, the US accounted for 40% of the global economy, but this share has been cut almost in half since then, despite a rising national GDP and being the birthplace of some of the biggest companies on the planet . As of 2019, the US made up almost a quarter of the global economy . The decline of America’s contribution to global GDP has been slow and uneven, with crests and troughs along the way. Between 1965 and 1980, the country’s share fell by 13 percentage points, mainly due to stagflation of the 1970s. This decline was followed by Reaganomics and a period of strong recovery, which helped propel the US share of the global economy back up to 34% by 1985. The whipsawing would continue. Between 1985 and 1995, the US share fell by another 11 percentage points, only to bounce back to a local peak of 30% by the year 2000. Since the beginning of the 21st century, growth in many developing markets has continued at a rapid pace, and the US share of the global economy has decreased as a result. Until 2005, the US still accounted for 28% of global GDP, but the Global Financial Crisis left a big dent, and its share fell to 23% by 2010. It has since remained relatively stable at 24% .
In the third quarter of 2023, the US dollar’s share in the global central bank reserves sunk to 59.2% . This trend is part of a larger de-dollarization trend, which has been ongoing for years. The US dollar has been the world’s dominant reserve currency since the end of World War II, but its share of global reserves has been declining in recent years. The US dollar’s share of global reserves peaked at 72.7% in 2001 and has been declining ever since .
It is important to note that the COVID-19 pandemic has changed the course of the global economy, with most countries experiencing a recession in 2020. America’s economic position will depend on how quickly it can recover compared to the rest of the world .
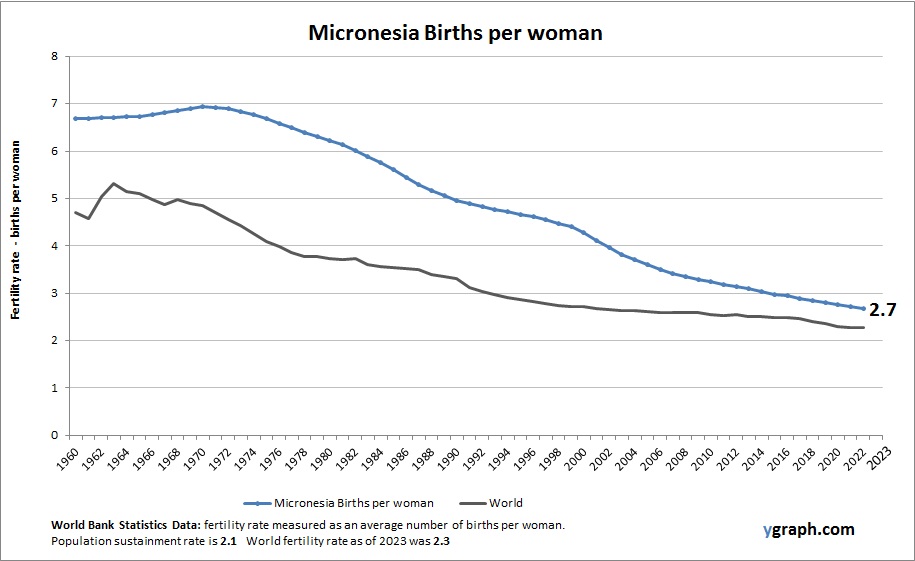
This diagram presents Micronesia Births per woman. The fertility rate statistics are compiled by World Bank. Latest births per woman information for Micronesia.
Micronesia maintains relatively high fertility rates, reflective of traditional values and limited access to modern contraception in rural communities. However, migration and increased urbanization are slowly influencing reproductive behavior and lowering birth rates in some areas.
Political Spectrum: The political spectrum categorizes political ideologies from left to right. Left-wing ideologies focus on social equality and government intervention, while right-wing ideologies emphasize individual freedom and limited government.