Top Charts, Graphs and Diagrams

Featured

Edraw Examples

Edraw Examples is a comprehensive library of diagram examples that can be used as reference material for creating diagrams. The examples are categorized into different types of diagrams such as flowcharts, mind maps, organizational charts, and more. The examples are available for free on the Edraw website.

The examples are designed to help users understand how to create diagrams and provide inspiration for their own projects. The examples are created using EdrawMax, a powerful diagramming tool that allows users to create professional-looking diagrams with ease. The tool is available for Windows, Mac, and Linux operating systems.

The Edraw Examples library contains a wide range of examples for different types of diagrams. For example, there are examples for flowcharts, mind maps, organizational charts, floor plans, and more. Each example is accompanied by a brief description of the diagram and its purpose. Users can use these descriptions to understand the context of the diagram and how it can be used in their own projects.

In addition to the Edraw Examples library, EdrawMax also provides a wide range of templates that can be used as a starting point for creating diagrams. The templates are available for different types of diagrams and are designed to help users get started quickly. The templates are fully customizable, allowing users to modify them to suit their specific needs.

Overall, Edraw Examples is an excellent resource for anyone looking to create professional-looking diagrams. The library provides a wide range of examples for different types of diagrams, and the accompanying descriptions help users understand the context of each diagram. Additionally, the EdrawMax tool provides a wide range of templates that can be used as a starting point for creating diagrams.

Edraw Examples

Complex Numbers

Complex numbers are a fundamental concept in mathematics that extends the real numbers with a specific element denoted `i`, called the imaginary unit. Every complex number can be expressed in the form `a + bi`, where `a` and `b` are real numbers. The real part of a complex number is denoted by `Re(z)` and the imaginary part is denoted by `Im(z)`.

The imaginary unit `i` satisfies the equation `i^2 = -1`. Despite the historical nomenclature “imaginary”, complex numbers are regarded in the mathematical sciences as just as “real” as the real numbers and are fundamental in many aspects of the scientific description of the natural world .

A complex number can be visually represented as a pair of numbers `(a, b)` forming a vector on a diagram called an Argand diagram, representing the complex plane. The real axis is denoted by `Re` and the imaginary axis is denoted by `Im`. The set of complex numbers is denoted by either of the symbols `C` or `?` .

The addition, subtraction, and multiplication of complex numbers can be naturally defined by using the rule `i^2 = -1` combined with the associative, commutative, and distributive laws. Every nonzero complex number has a multiplicative inverse. This makes the complex numbers a field that has the real numbers as a subfield .

The complex numbers also form a real vector space of dimension two, with `{1, i}` as a standard basis. This standard basis makes the complex numbers a Cartesian plane, called the complex plane. This allows a geometric interpretation of the complex numbers and their operations, and conversely expressing in terms of complex numbers some geometric properties and constructions .

Complex numbers allow solutions to all polynomial equations, even those that have no solutions in real numbers. More precisely, the fundamental theorem of algebra asserts that every non-constant polynomial equation with real or complex coefficients has a solution which is a complex number. For example, the equation `x^2 + 1 = 0` has no real solution, since the square of a real number

Complex Numbers

Farmer Diagram

A farmer is a person who is involved in the cultivation and management of crops and/or livestock for the purpose of producing food, fiber, or other agricultural products. The term usually applies to people who do some combination of raising field crops, orchards, vineyards, poultry, or other livestock. A farmer might own the farmland or might work as a laborer on land owned by others.

Farming dates back as far as the Neolithic era, being one of the defining characteristics of that era. By the Bronze Age, the Sumerians had an agriculture specialized labor force by 5000–4000 BCE, and heavily depended on irrigation to grow crops. Animal husbandry, the practice of rearing animals specifically for farming purposes, has existed for thousands of years. Dogs were domesticated in East Asia about 15,000 years ago. Goats and sheep were domesticated around 8000 BCE in Asia. Swine or pigs were domesticated by 7000 BCE in the Middle East and China. The earliest evidence of horse domestication dates to around 4000 BCE.

Over half a billion farmers are smallholders, most of whom are in developing countries and who economically support almost two billion people. Globally, women constitute more than 40% of agricultural employees.

In the US of the 1930s, one farmer could produce only enough food to feed three other consumers. A modern farmer produces enough food to feed well over a hundred people. However, some authors consider this estimate to be flawed, as it does not take into account that farming requires energy and many other resources which have to be provided by additional workers, so that the ratio of people fed to farmers is actually smaller than 100 to 1.

Agriculture is a complex and diverse field, and there are many different types of farmers. For example, a crop farmer is someone who grows crops such as grains, vegetables, fruits, and nuts. A livestock farmer is someone who raises animals such as cows, pigs, sheep, and chickens for meat, milk, eggs, wool, or other products. A dairy farmer is someone who specializes in the production of milk and other dairy products. A poultry farmer is someone who raises chickens, turkeys, ducks, or other birds for meat or eggs. A fish farmer is someone who raises fish in ponds, tanks, or other aquatic environments for food or other purposes. A beekeeper is someone who keeps bees for honey, beeswax, or other products.

Farming is a challenging and rewarding profession that requires a wide range of skills and knowledge. Farmers must be able to manage their resources effectively, including soil, water, and energy. They must also be able to adapt to changing weather patterns, market conditions, and other factors that can affect their crops or livestock. In addition, farmers must be able to operate and maintain a variety of equipment, such as tractors, combines, and other machinery.

In conclusion, farmers play a vital role in our society by producing the food and other agricultural products that we rely on every day. They are responsible for feeding billions of people around the world, and their work is essential to our survival and well-being. Despite the challenges they face, farmers continue to innovate and adapt to new technologies and practices, ensuring that we have access

Farmer Diagram

Uk Economy And Coronavirus

The UK economy has been significantly impacted by the COVID-19 pandemic. According to the Office for National Statistics (ONS), the UK’s Gross Domestic Product (GDP), which is the value of everything produced in the economy, was 9.9% down in 2020 compared with 2019. The pandemic has had a severe impact on the UK economy, with strict restrictions imposed for a lot of the year as a result of coronavirus. The UK economy is also reliant on consumer spending on things like hotels, restaurants, and leisure activities, which have been badly hit by lockdowns .

However, Chancellor Rishi Sunak says the GDP slump is “comparable to other countries” and that the UK’s performance is very much in line and comparable to other countries and, in fact, it may be on a margin better than places like Canada, Germany, Italy, and Spain . The ONS explains that the UK calculates GDP in a different way to pretty much everybody else. The tricky part is how you work out the output of public services such as healthcare or education. If you want to know the output of a normal business, you just look at how much it has made from selling its goods or services. That doesn’t work as well with the public sector, so the ONS bases its figure on measures such as how many people have seen a GP, how many operations have taken place, and the number of pupils receiving education. Things like the closure of schools and the cancellation of non-urgent operations meant that the output of public services took a big hit in the pandemic. Other countries tend to base their figures either on how much money has been spent on public services or how many hours have been worked by staff delivering them. As the amount of money spent has not fallen, that method would show less of a drop in their output. That is also how the ONS works out GDP in nominal or cash terms .

The Organisation for Economic Co-operation and Development (OECD) has warned that the UK is likely to be the hardest hit by COVID-19 among major economies. Britain’s economy is likely to slump by 11.5% in

Uk Economy And Coronavirus

Basic Economics Circular Flow Diagram

The basic economics circular flow is a model that illustrates how money, goods, and services move between different sectors in an economy. It is also used to measure the national income or GDP of a country. Here is an essay that explains the concept in more detail:

The circular flow model is one of the most basic concepts in macroeconomics. It shows how money and economic resources flow in cycles between different agents in an economic system. The model can be simplified or expanded to include different sectors, such as households, businesses, government, foreign, and financial sectors. The model helps us understand how the economy works and how the national income or GDP is calculated.

The simplest version of the circular flow model is the two-sector model, which consists of only households and businesses. In this model, households provide labor and other factors of production to businesses in exchange for income, such as wages, rent, interest, and profit. This is the flow of money in the factor market. Businesses use the factors of production

Basic Economics Circular Flow Diagram

4 Sector Circular Flow Diagram

The Four Sector Circular Flow Model is a macroeconomic model that describes the flow of goods and services, income, and expenditure among four primary sectors of an economy: households, businesses, the government, and the foreign sector. This model is considered to be the most realistic one under current world conditions .

In this model, every sector plays a dual role, receiving payments from other sectors while also paying them in one form or another. The household sector is responsible for providing resources to businesses and the public in the form of labor, professionals, and capital. They earn income in the form of rent on owned properties, fees, and remuneration for work and services provided to other sectors as well as to the household segment . The business sector produces goods and services and sells them to households and the government. They also pay wages and salaries to the household sector and taxes to the government . The government sector collects taxes from households and businesses and provides public goods and services such as infrastructure, education, and healthcare. They also make transfer payments to households and businesses in the form of subsidies and welfare activities . Finally, the foreign sector represents the export and import of goods and services. In this model, imports are treated as expenditure and become a leakage, while exports boost national income .

The Four Sector Model is also known as an Open Economy Model because it includes foreign transactions and treats them as an integral part of the economy . The model assumes that there are no restrictions on the import and export of goods and services in general, although specific restrictions may exist based on the trading country, product, etc. . The model also assumes that both domestic and foreign markets feature perfect competition .

The Four Sector Model is an improvement over the Two Sector and Three Sector Models, which represented closed economies that are no longer relevant in current times . The Four Sector Model is more realistic and practical as it consists of four primary sectors, and foreign transactions are included and integrated into the model .

To determine the equilibrium output/income in the Four Sector Model, we need to consider the role of each sector in detail. The household sector is the largest consumer of goods and services, and their consumption expenditure is the largest component of aggregate demand. The business sector is the largest producer of goods and services, and their investment expenditure is the largest component of aggregate demand. The government sector is the largest provider of public goods and services, and their expenditure is the largest component of aggregate demand. The foreign sector is the largest importer and exporter of goods and services, and their net exports are the largest component of aggregate demand .

In conclusion, the Four Sector Circular Flow Model is a macroeconomic model that describes the flow of goods and services, income, and expenditure among four primary sectors of an economy: households, businesses, the government, and the foreign sector. It is the most realistic model under current world conditions and includes foreign transactions as an integral part of the economy. Each sector plays a dual role, receiving payments from other sectors while also paying them in one form or another. The Four Sector Model is an improvement over the Two Sector and Three Sector Models, which represented closed economies that are no longer relevant in current times. The model is used to determine the equilibrium output/income in an economy by considering the role of each sector in detail .

4 Sector Circular Flow Diagram

Flow Diagram Depicting Precision Agriculture In Crop Production 82

Flow depicting precision agriculture in crop production is a process that involves the use of technology to optimize crop yield and reduce waste. Precision agriculture (PA) is a farming technique that uses a range of technologies or diagnostic tools such as global navigation satellite system (GNSS), geographic information systems (GIS), yield monitors, near-infrared reflectance sensing, and remote sensing in collecting and analyzing the in-field spatial variability data, thereby enabling farmers to monitor and make site-specific management decisions for soils and crops . PA technology enables visualization of spatial and temporal variations of production resources and supports spatially varying treatments using variable rate application technologies installed on farm agricultural field machinery . The demand for PA is driven by recognition within-field variability and opportunities for treating areas within a field or production unit differently .

PA can be applied to multiple cultural practices including tillage, precision seeding, variable rate fertilizer application, precision irrigation and selective pesticide application; and facilitates other management decisions making, for example, site-specific deep tillage to remove soil compaction . PA technology ensures optimal use of production inputs and contributes to a significant increase in farm profitability. By reducing crop production inputs and managing farmland in an environmentally sensible manner, PA technology plays a vital role in sustainable soil and crop management in modern agriculture .

The use of PA technology in crop production has several benefits. It helps farmers to identify the most productive areas of their fields and adjust their management practices accordingly . This can lead to increased crop yields and reduced input costs, which in turn can increase farm profitability . PA technology also helps farmers to reduce the environmental impact of their operations by minimizing the use of fertilizers, pesticides, and other chemicals . This can help to reduce soil erosion, improve water quality, and protect wildlife habitats .

In conclusion, precision agriculture is a promising technology that can help farmers to optimize crop yield, reduce waste, and improve the sustainability of their operations. By using a range of diagnostic tools and technologies, farmers can monitor and manage their fields in a site-specific manner, thereby improving the efficiency of their operations and reducing their environmental impact. PA technology is an important tool for modern agriculture and has the potential to revolutionize the way we produce food in the future.

: Shaheb, M. R., Sarker, A., & Shearer, S. A. (2022). Precision Agriculture for Sustainable Soil and Crop Management. In Soil Science – Emerging Technologies, Global Perspectives and Applications (pp. 1-20). IntechOpen..

Flow Diagram Depicting Precision Agriculture In Crop Production 82

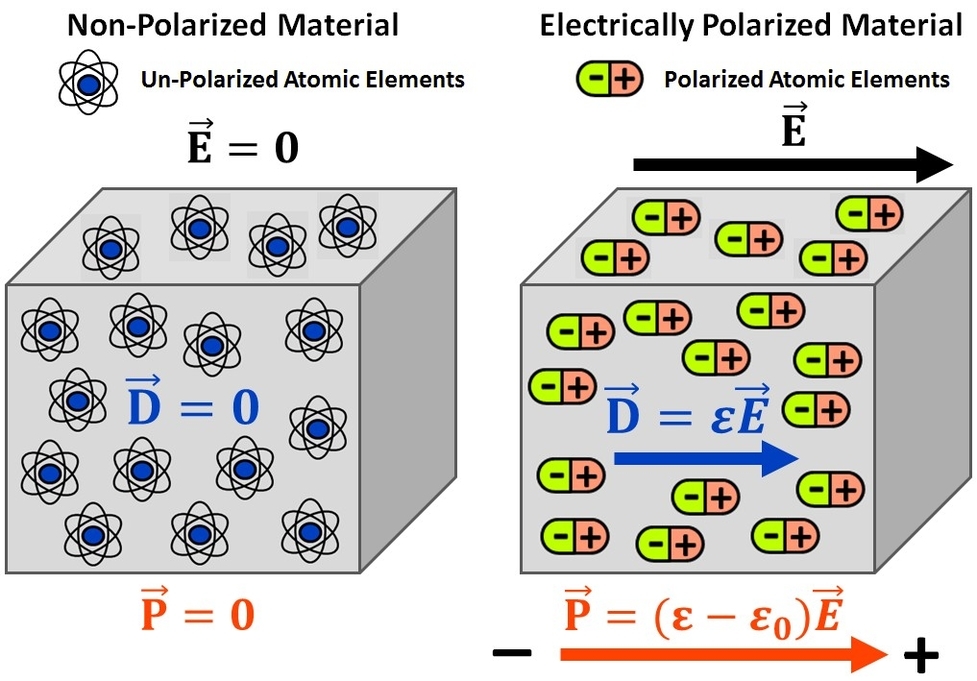
Physics Important Diagrams

Physics is a fundamental branch of science that deals with the study of matter, energy, and their interactions. It is concerned with understanding the natural world and the laws that govern it. Physics is an important subject because it helps us understand the fundamental nature of the universe and the physical laws that govern it. It is also a key driver of technological advancement, and has led to many of the technological innovations that we take for granted today.

One of the most important contributions of physics is its role in developing our understanding of the universe. Through the study of physics, we have been able to develop a comprehensive understanding of the fundamental laws that govern the behavior of matter and energy. This has allowed us to develop models of the universe that are able to explain a wide range of phenomena, from the behavior of subatomic particles to the structure of galaxies.

Another important contribution of physics is its role in technological innovation. Many of the technological innovations that we take for granted today, such as computers, smartphones, and the internet, are based on the principles of physics. Physics has also played a key role in the development of renewable energy technologies, such as solar panels and wind turbines, which are essential for reducing our reliance on fossil fuels.

In addition to its contributions to our understanding of the universe and technological innovation, physics is also important because it helps us develop critical thinking skills. The study of physics requires us to think logically and systematically, and to develop a deep understanding of complex systems. These skills are essential for success in many fields, including engineering, medicine, and finance.

In summary, physics is an important subject that has contributed greatly to our understanding of the universe and technological innovation. It is also an essential tool for developing critical thinking skills, which are essential for success in many fields.

Physics Important Diagrams

Timeline Of Timeline

The concept of a timeline has been around for centuries, and it has been used to represent a wide range of information. A timeline is a graphical representation of a sequence of events, usually in chronological order. It is often used to illustrate the history of a particular subject, such as a person, a place, or an event. Timelines can be used to show the development of a particular field of study, the evolution of a species, or the history of a nation.

The Timeline of Timeline is a timeline that documents the history of the concept of a timeline itself. It is a meta-timeline, if you will. The Timeline of Timeline begins with the earliest known examples of timelines, which date back to ancient civilizations such as the Egyptians and the Greeks. These early timelines were often used to record historical events, such as the reigns of kings and queens, or the construction of important buildings.

As time progressed, the use of timelines became more widespread, and they began to be used to represent a wider range of information. For example, timelines were used to show the development of scientific theories, the history of art, and the evolution of technology. The Timeline of Timeline documents these developments, and shows how the concept of a timeline has evolved over time.

One of the most significant developments in the history of timelines was the invention of the printing press in the 15th century. This made it possible to produce large numbers of printed books, including books that contained timelines. The Timeline of Timeline documents the impact that the printing press had on the development of timelines, and how it made it possible for people to access information about historical events more easily.

Another important development in the history of timelines was the advent of the internet. The internet has made it possible to access vast amounts of information about historical events, and has made it easier than ever before to create and share timelines. The Timeline of Timeline documents the impact that the internet has had on the development of timelines, and how it has made it possible for people to collaborate on timelines and share them with others.

In conclusion,

Timeline Of Timeline

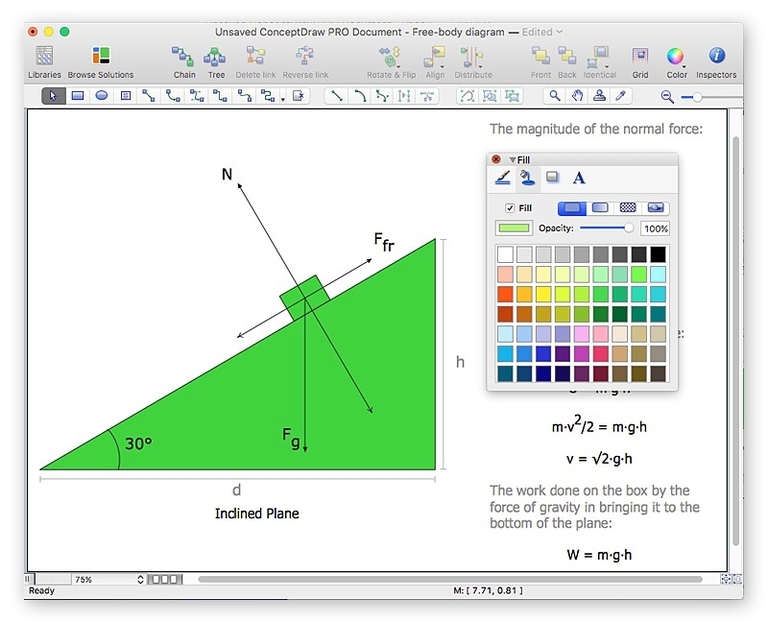
Diagrams Physics

Physics is the natural science that studies matter, energy, and their interactions. It is one of the most fundamental scientific disciplines, with its main goal being to understand how the universe behaves . The study of physics has led to many technological advancements that have transformed modern-day society, such as television, computers, domestic appliances, and nuclear weapons .

The field of physics is vast and encompasses a wide range of topics, including mechanics, thermodynamics, electromagnetism, optics, and quantum mechanics, among others . Each of these topics is concerned with different aspects of the physical world and has its own set of laws and principles that govern it.

Mechanics is the branch of physics that deals with the motion of objects and the forces that cause this motion . It is divided into two main branches: classical mechanics and quantum mechanics. Classical mechanics deals with the motion of macroscopic objects, while quantum mechanics deals with the behavior of subatomic particles .

Thermodynamics is the branch of physics that deals with the relationships between heat, work, and energy . It is concerned with the behavior of large systems and is used to study phenomena such as phase transitions, chemical reactions, and the behavior of gases .

Electromagnetism is the branch of physics that deals with the behavior of electrically charged particles and the electromagnetic fields that they create . It is concerned with phenomena such as electric and magnetic fields, electromagnetic waves, and the behavior of charged particles in electric and magnetic fields .

Optics is the branch of physics that deals with the behavior of light and its interactions with matter . It is concerned with phenomena such as reflection, refraction, diffraction, and interference .

Quantum mechanics is the branch of physics that deals with the behavior of matter and energy at the atomic and subatomic level . It is concerned with phenomena such as wave-particle duality, quantum entanglement, and the uncertainty principle .

In conclusion, physics is a vast and fascinating field that has contributed immensely to our understanding of the universe and has led to many technological advancements that have transformed modern-day society. The topics covered in physics are diverse and range from mechanics to quantum mechanics, each with its own set of laws and principles that govern it ..

Diagrams Physics