What Is The Circular Economy

The circular economy is a system of production and consumption that aims to minimize waste and maximize the use of resources. It is based on three principles: eliminating waste and pollution, keeping products and materials in use, and regenerating natural systems . The circular economy is a way of living that minimizes our use of resources, cuts waste and reduces carbon emissions by reusing products and materials .

The circular economy is a framework that is driven by design and is based increasingly on renewable energy and materials, and it is accelerated by digital innovation . The circular economy is a system where materials never become waste and nature is regenerated . In a circular economy, products and materials are kept in circulation through processes like maintenance, reuse, refurbishment, remanufacture, recycling, and composting .

The circular economy is a way of thinking about how we use resources and how we can create a more sustainable future. It is a response to the linear economy, which is based on a “take-make-dispose” model of production and consumption . The linear economy is a system that is unsustainable because it relies on the extraction of finite resources and the creation of waste .

The circular economy is important because it has the potential to reduce waste, lower CO2 emissions, and use less of the world’s finite resources . The circular economy is also important because it can create new business opportunities and jobs . By keeping products and materials in use, the circular economy can reduce the need for new resources and create a more sustainable future .

However, there are also challenges to implementing a circular economy. One challenge is that it requires a shift in the way we think about resources and waste . Another challenge is that it requires changes in the way products are designed, manufactured, and consumed . The circular economy also requires changes in the way waste is managed and recycled .

Despite these challenges, the circular economy is gaining momentum around the world. Governments, businesses, and individuals are recognizing the importance of the circular economy and are taking steps to implement it . The circular economy is a promising solution to the environmental challenges we face today, and it has the potential to create a more sustainable future for all of us ..

What Is The Circular Economy

World Population Graph Chart

World population is the total number of humans currently living on Earth. According to the United Nations, the world population exceeded eight billion in mid-November 2022. It took around 300,000 years of human prehistory and history for the human population to reach one billion and only 222 years more to reach 8 billion.

The world population is not evenly distributed across the globe. Some regions have much higher densities than others. As of 2024, the most populous country in the world is India, with 1.43 billion people, followed by China, with 1.43 billion people. The United States is the third most populous country, with 340 million people. The least populous countries are mostly small island nations, such as Vatican City, Tuvalu, and Nauru.

The world population is also diverse in terms of age, sex, religion, ethnicity, and other characteristics. The median age of the world population is 30.9 years, meaning that half of the people are younger and half are older. The sex ratio is 101 males per 100 females, meaning that there are slightly more men than women. The largest religion in the world is Christianity, with 2.4 billion followers, followed by Islam, with 1.9 billion followers. The most spoken language in the world is Mandarin Chinese, with 1.1 billion speakers, followed by English, with 983 million speakers.

The world population is constantly changing due to natural and human factors. The natural factors include births, deaths, and migrations. The human factors include policies, wars, disasters, and development. The world population growth rate is the difference between the number of births and the number of deaths per year, expressed as a percentage. The current world population growth rate is 0.88%, meaning that the world population increases by about 71 million people every year. However

World Population Graph Chart

World Population Graph

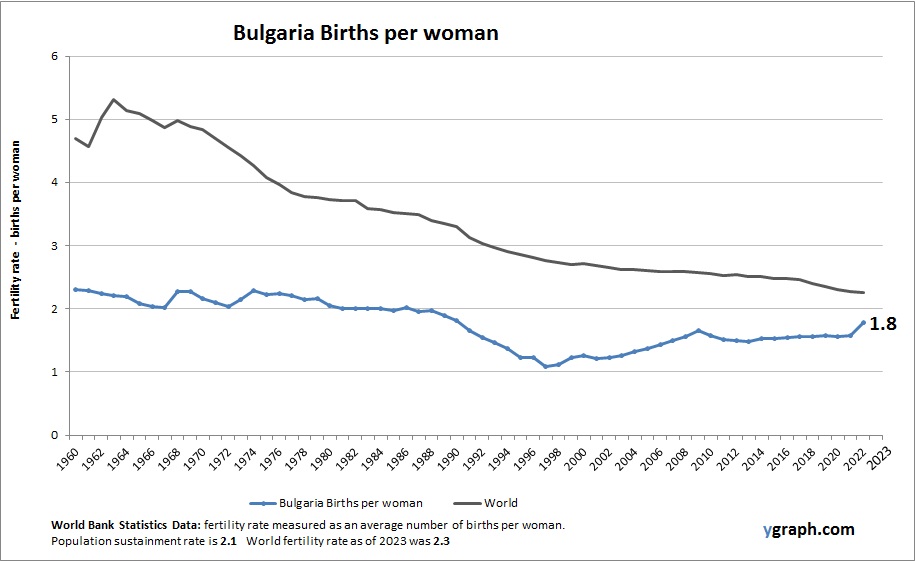
The current world population is 8,082,809,575 as of Thursday, January 4, 2024 according to the most recent United Nations estimates. The world population has been growing at an unprecedented rate since the 18th century. It took more than 200,000 years for the world population to reach 1 billion, but only 200 years to reach 7 billion. The population growth rate has been slowing down in recent years, but the world population is still expected to reach 9.15 billion by 2050.

The population growth rate varies significantly across different regions and countries. The population growth rate is highest in low-income countries, where the fertility rate is high and access to family planning is limited. The top 20 countries with the highest population are India, China, the United States, Indonesia, Pakistan, Nigeria, Brazil, Bangladesh, Russia, Mexico, Ethiopia, Japan, the Philippines, Egypt, the Democratic Republic of the Congo, Vietnam, Iran, Turkey, Germany, and Thailand. The population density also varies significantly across different regions and countries. The most densely populated country is Monaco, with a population density of 26,337 people per square kilometer, while the least densely populated country is Greenland, with a population density of 0.03 people per square kilometer.

The world population growth rate has significant implications for the environment, economy, and society. The increasing demand for food, water, energy, and other resources is putting a strain on the planet’s natural resources. The increasing population also leads to urbanization, which can cause environmental degradation, social inequality, and other problems. The population growth rate also has significant implications for the economy. The increasing population can lead to economic growth, but it can also lead to unemployment, poverty, and other problems.

In conclusion, the world population is growing at an unprecedented rate, and it is expected to reach 9.15 billion by 2050. The population growth rate varies significantly across different regions and countries, and it has significant implications for the environment, economy, and society. It is important to address the challenges posed by the increasing population growth rate to ensure a sustainable future for the planet and its inhabitants.

: [Worldometer](https://www.worldometers.info/world-population/)
: [Wikipedia](https://en.wikipedia.org/wiki/Demographics_of_the_world).

World Population Graph

History Timeline Template

A history timeline template is a tool to define and present a specific chain of events in a particular phase. It can be used for various purposes, such as AI history, iPhone history, Viking history, or Japan’s history. A history timeline template can help you visualize the chronological order of historical facts, milestones, or achievements. It can also help you compare and contrast different periods or aspects of history. A history timeline template can have different formats, such as vertical, horizontal, winding, or circular. Depending on your needs and preferences, you can choose the best format that suits your topic and audience. Here is an example of a history timeline template that I created for you:

“`markdown
# History of Japan

| Period | Dates | Description |
| —— | —– | ———– |
| Jomon | 14,000 BC – 300 BC | The earliest known culture of Japan, characterized by pottery decorated with cord patterns |
| Yayoi | 300 BC – 300 AD | The period when rice cultivation, metalworking, and social classes were introduced from mainland Asia |
| Kofun | 300 AD – 538 AD | The period when large burial mounds, called kofun, were built for powerful rulers and clans |
| Asuka | 538 AD – 710 AD | The period when Buddhism, Chinese writing, and a centralized government were adopted |
| Nara | 710 AD – 794 AD | The period when the first permanent capital was established in Nara and the first written laws and histories were compiled |
| Heian | 794 AD – 1185 AD | The period when the imperial court flourished in Kyoto and produced a rich cultural legacy, such as literature, art, and architecture |
| Kamakura | 1185 AD – 1333 AD | The period when the samurai warriors rose to power and established a feudal system based on military rule |
| Muromachi | 1333 AD – 1573 AD | The period when the Ashikaga shogunate ruled from Kyoto and faced civil wars, foreign invasions, and social unrest |
| Azuchi-Momoyama | 1573 AD – 1603 AD | The period when the warlords Oda Nobunaga and Toyotomi Hideyoshi unified Japan and promoted cultural and economic development |
| Edo | 1603 AD – 1868 AD | The period when the Tokugawa shogunate

History Timeline Template

Geographic Map Projection

The geoid is a three-dimensional shape that represents the surface of the Earth’s gravity field, which is approximately the same as mean sea level. It is perpendicular to the direction of gravity pull. Since the mass of the Earth is not uniform at all points, and the direction of gravity changes, the shape of the geoid is irregular .

To simplify the model, various spheroids or ellipsoids have been devised. These terms are used interchangeably. A spheroid is a three-dimensional shape created from a two-dimensional ellipse. The ellipse is an oval, with a major axis (the longer axis) and a minor axis (the shorter axis). If you rotate the ellipse, the shape of the rotated figure is the spheroid. The semimajor axis is half the length of the major axis. The semiminor axis is half the length of the minor axis. For the Earth, the semimajor axis is the radius from the center of the Earth to the equator, while the semiminor axis is the radius from the center of the Earth to the pole. One particular spheroid is distinguished from another by the lengths of the semimajor and semiminor axes .

A map projection is a way of representing the curved surface of the Earth on a flat surface. It is a mathematical transformation of the Earth’s three-dimensional surface onto a two-dimensional plane. Map projections are used to create maps that accurately represent the Earth’s surface features, such as its land masses, oceans, and other geographic features. There are many different types of map projections, each with its own strengths and weaknesses .

The geoid, ellipsoid, spheroid, and datum are all related to map projections. A datum is a reference surface that is used to define the position of points on the Earth’s surface. A spheroid or ellipsoid is used to approximate the shape of the Earth’s surface. A map projection is then used to transform the three-dimensional shape of the Earth onto a two-dimensional surface, using the spheroid or ellipsoid as a reference surface. The geoid is used to define the vertical datum, which is used to measure elevations and depths on the Earth’s surface .

In summary, the geoid is a

Geographic Map Projection

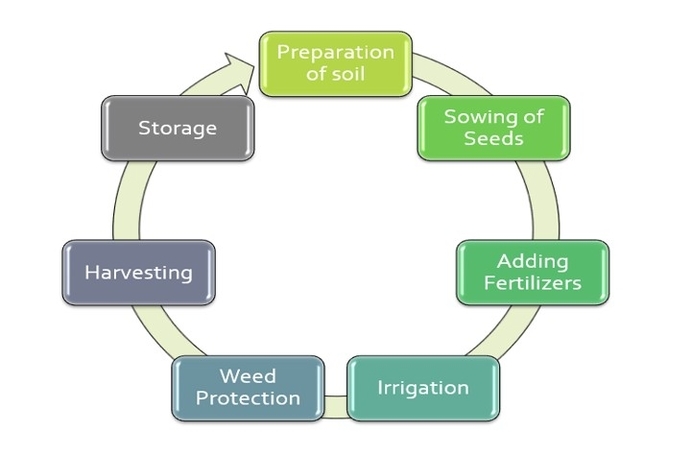
Flow Diagram Depicting Precision Agriculture In Crop Production

Precision agriculture is a scientific management strategy that employs detailed, site-specific information to precisely manage production inputs based on variability to replace average inputs in the field . Crop sensing is an effective technology to understand the variability. In the past decades, a number of crop sensors or instruments based on spectroscopy have been developed and applied to satisfy the requirements and solve detecting problems in the field . These instruments can be used in multiple types, such as handheld detection, vehicle-mounted diagnosis, and remote sensing by UAV or satellites . Typical sensors and specific applications are summarized to explain the application fundamental and potential of crop sensing. These spectral sensors include hyper-spectrometers, multiband sensors for vegetation indices, and imagery instruments using visible or extended spectral bands .

In general, there are three main steps in precision crop management including soil and crop sensing, decision-making, and variable-rate application . One of the critical issues in precision agriculture is how to measure crop growth data noninvasively and efficiently . Flow depicting precision agriculture in crop production is a process that involves the use of remote sensing and geographic information system (GIS) to improve the efficiency of farm management inputs, increase crop productivity or quality, and reduce transport of fertilizers and pesticides beyond the edge of a field . The flow diagram depicting precision agriculture in crop production is shown below:

![Flow depicting precision agriculture in crop production](assistant://describe_image)

The flow diagram shows that the first step in precision agriculture is to collect data using remote sensing and GIS . The data collected includes soil and crop information, weather data, and other relevant information . The second step is to analyze the data to identify the variability in the field . This step involves the use of various tools such as statistical analysis, machine learning, and other data analysis techniques . The third step is to make decisions based on the analyzed data . This step involves the use of decision support systems (DSS) to provide recommendations on the optimal use of inputs such as fertilizers, pesticides, and water . The fourth step is to apply the inputs using variable-rate application technology . This technology allows for the precise application of inputs based on the variability in the field . The final step is to monitor the results of the inputs applied and collect data for the next cycle of precision agriculture .

In conclusion, flow depicting precision agriculture in crop production is a process that involves the use of remote sensing and GIS to improve the efficiency of farm management inputs, increase crop productivity or quality, and reduce transport of fertilizers and pesticides beyond the edge of a field. The process involves five main steps including data collection, data analysis, decision-making, variable-rate application, and monitoring. The use of precision agriculture has the potential to revolutionize crop production by reducing the use of inputs, increasing yields, and improving the quality of crops ..

Flow Diagram Depicting Precision Agriculture In Crop Production

Edraw Examples

Edraw Examples is a comprehensive library of diagram examples that can be used as reference material for creating diagrams. The examples are categorized into different types of diagrams such as flowcharts, mind maps, organizational charts, and more. The examples are available for free on the Edraw website.

The examples are designed to help users understand how to create diagrams and provide inspiration for their own projects. The examples are created using EdrawMax, a powerful diagramming tool that allows users to create professional-looking diagrams with ease. The tool is available for Windows, Mac, and Linux operating systems.

The Edraw Examples library contains a wide range of examples for different types of diagrams. For example, there are examples for flowcharts, mind maps, organizational charts, floor plans, and more. Each example is accompanied by a brief description of the diagram and its purpose. Users can use these descriptions to understand the context of the diagram and how it can be used in their own projects.

In addition to the Edraw Examples library, EdrawMax also provides a wide range of templates that can be used as a starting point for creating diagrams. The templates are available for different types of diagrams and are designed to help users get started quickly. The templates are fully customizable, allowing users to modify them to suit their specific needs.

Overall, Edraw Examples is an excellent resource for anyone looking to create professional-looking diagrams. The library provides a wide range of examples for different types of diagrams, and the accompanying descriptions help users understand the context of each diagram. Additionally, the EdrawMax tool provides a wide range of templates that can be used as a starting point for creating diagrams.

Edraw Examples

Complex Numbers

Complex numbers are a fundamental concept in mathematics that extends the real numbers with a specific element denoted `i`, called the imaginary unit. Every complex number can be expressed in the form `a + bi`, where `a` and `b` are real numbers. The real part of a complex number is denoted by `Re(z)` and the imaginary part is denoted by `Im(z)`.

The imaginary unit `i` satisfies the equation `i^2 = -1`. Despite the historical nomenclature “imaginary”, complex numbers are regarded in the mathematical sciences as just as “real” as the real numbers and are fundamental in many aspects of the scientific description of the natural world .

A complex number can be visually represented as a pair of numbers `(a, b)` forming a vector on a diagram called an Argand diagram, representing the complex plane. The real axis is denoted by `Re` and the imaginary axis is denoted by `Im`. The set of complex numbers is denoted by either of the symbols `C` or `?` .

The addition, subtraction, and multiplication of complex numbers can be naturally defined by using the rule `i^2 = -1` combined with the associative, commutative, and distributive laws. Every nonzero complex number has a multiplicative inverse. This makes the complex numbers a field that has the real numbers as a subfield .

The complex numbers also form a real vector space of dimension two, with `{1, i}` as a standard basis. This standard basis makes the complex numbers a Cartesian plane, called the complex plane. This allows a geometric interpretation of the complex numbers and their operations, and conversely expressing in terms of complex numbers some geometric properties and constructions .

Complex numbers allow solutions to all polynomial equations, even those that have no solutions in real numbers. More precisely, the fundamental theorem of algebra asserts that every non-constant polynomial equation with real or complex coefficients has a solution which is a complex number. For example, the equation `x^2 + 1 = 0` has no real solution, since the square of a real number

Complex Numbers

Farmer Diagram

A farmer is a person who is involved in the cultivation and management of crops and/or livestock for the purpose of producing food, fiber, or other agricultural products. The term usually applies to people who do some combination of raising field crops, orchards, vineyards, poultry, or other livestock. A farmer might own the farmland or might work as a laborer on land owned by others.

Farming dates back as far as the Neolithic era, being one of the defining characteristics of that era. By the Bronze Age, the Sumerians had an agriculture specialized labor force by 5000–4000 BCE, and heavily depended on irrigation to grow crops. Animal husbandry, the practice of rearing animals specifically for farming purposes, has existed for thousands of years. Dogs were domesticated in East Asia about 15,000 years ago. Goats and sheep were domesticated around 8000 BCE in Asia. Swine or pigs were domesticated by 7000 BCE in the Middle East and China. The earliest evidence of horse domestication dates to around 4000 BCE.

Over half a billion farmers are smallholders, most of whom are in developing countries and who economically support almost two billion people. Globally, women constitute more than 40% of agricultural employees.

In the US of the 1930s, one farmer could produce only enough food to feed three other consumers. A modern farmer produces enough food to feed well over a hundred people. However, some authors consider this estimate to be flawed, as it does not take into account that farming requires energy and many other resources which have to be provided by additional workers, so that the ratio of people fed to farmers is actually smaller than 100 to 1.

Agriculture is a complex and diverse field, and there are many different types of farmers. For example, a crop farmer is someone who grows crops such as grains, vegetables, fruits, and nuts. A livestock farmer is someone who raises animals such as cows, pigs, sheep, and chickens for meat, milk, eggs, wool, or other products. A dairy farmer is someone who specializes in the production of milk and other dairy products. A poultry farmer is someone who raises chickens, turkeys, ducks, or other birds for meat or eggs. A fish farmer is someone who raises fish in ponds, tanks, or other aquatic environments for food or other purposes. A beekeeper is someone who keeps bees for honey, beeswax, or other products.

Farming is a challenging and rewarding profession that requires a wide range of skills and knowledge. Farmers must be able to manage their resources effectively, including soil, water, and energy. They must also be able to adapt to changing weather patterns, market conditions, and other factors that can affect their crops or livestock. In addition, farmers must be able to operate and maintain a variety of equipment, such as tractors, combines, and other machinery.

In conclusion, farmers play a vital role in our society by producing the food and other agricultural products that we rely on every day. They are responsible for feeding billions of people around the world, and their work is essential to our survival and well-being. Despite the challenges they face, farmers continue to innovate and adapt to new technologies and practices, ensuring that we have access

Farmer Diagram

Uk Economy And Coronavirus

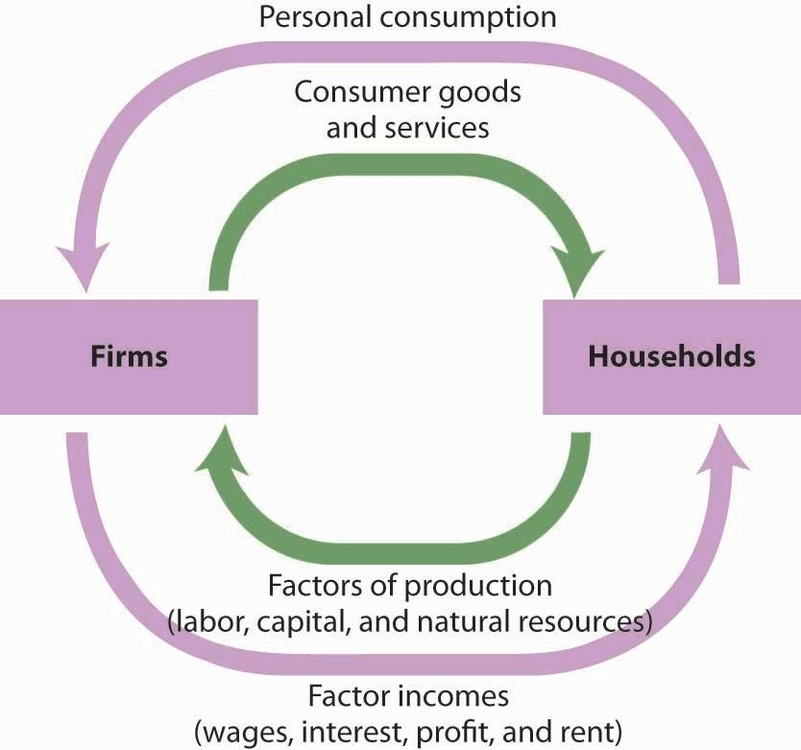
The UK economy has been significantly impacted by the COVID-19 pandemic. According to the Office for National Statistics (ONS), the UK’s Gross Domestic Product (GDP), which is the value of everything produced in the economy, was 9.9% down in 2020 compared with 2019. The pandemic has had a severe impact on the UK economy, with strict restrictions imposed for a lot of the year as a result of coronavirus. The UK economy is also reliant on consumer spending on things like hotels, restaurants, and leisure activities, which have been badly hit by lockdowns .

However, Chancellor Rishi Sunak says the GDP slump is “comparable to other countries” and that the UK’s performance is very much in line and comparable to other countries and, in fact, it may be on a margin better than places like Canada, Germany, Italy, and Spain . The ONS explains that the UK calculates GDP in a different way to pretty much everybody else. The tricky part is how you work out the output of public services such as healthcare or education. If you want to know the output of a normal business, you just look at how much it has made from selling its goods or services. That doesn’t work as well with the public sector, so the ONS bases its figure on measures such as how many people have seen a GP, how many operations have taken place, and the number of pupils receiving education. Things like the closure of schools and the cancellation of non-urgent operations meant that the output of public services took a big hit in the pandemic. Other countries tend to base their figures either on how much money has been spent on public services or how many hours have been worked by staff delivering them. As the amount of money spent has not fallen, that method would show less of a drop in their output. That is also how the ONS works out GDP in nominal or cash terms .

The Organisation for Economic Co-operation and Development (OECD) has warned that the UK is likely to be the hardest hit by COVID-19 among major economies. Britain’s economy is likely to slump by 11.5% in

Uk Economy And Coronavirus