Skip to content
cropped logo

Ygraph

Charts, Graphs and Diagrams

Menu

Primary menu

  • Submit Diagram
  • Science
  • Business
  • Economy
    • GDP
  • Demographics
  • Explained
    • Signs
    • Maps
  • Health
  • Anatomy
  • Sizes

Tag Archives: carbon cycle explained

Carbon Cycle Diagram

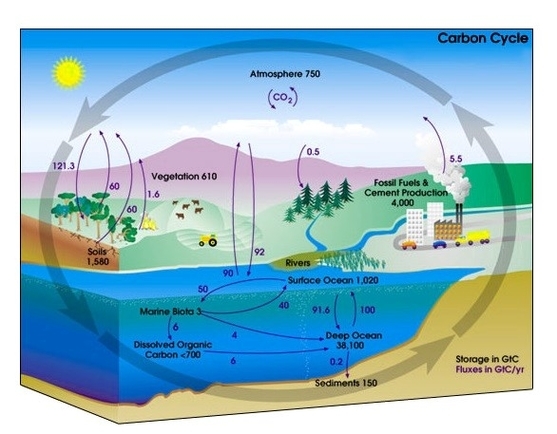
Carbon cycle diagram shows how carbon cycles through nature from one form to another. The below carbon diagram explains the natural cycle.

Carbon Cycle Diagram
Posted in chart, science | Tagged carbon cycle, carbon cycle chart, carbon cycle diagram, carbon cycle explained, carbon cycle parts

Primary Sidebar Widget Area

Top Diagrams

Latest Posts

  • How to Stop Time from Flying
  • Igcse Biology Virus Particle Diagram
  • Cyprus Births per woman
  • Research Methods In Psychology
  • Andorra Births per woman
  • Ruminant Digestive System
  • Dielectric Constant Or Relative Permittivity
  • Protista
  • Scientific Example Of
  • Combined Probability
  • Nolan Chart
  • Austria Population
  • Positive Psychology Theory Diagram
  • Chart Drawing Software
  • A Chart Of The Economy Of The World
  • Congo Population

Top Tags

  • sizes (35)
  • size chart (35)
  • size conversion (35)
  • economy chart (33)
  • economy graph (33)
  • economy diagram (33)
  • cell (29)
  • cell diagram (29)
  • cell illustration (29)
  • window (24)
  • window diagram (24)
  • types of windows (24)
  • origami (16)
  • origami steps (16)
  • how to make origami (16)
  • biology (16)
  • biology diagram (16)
  • yoga (8)
  • yoga routine (8)
  • yoga poses (8)

Categories

  • anatomy
  • Business
  • chart
  • Demographics
  • Eco
  • Ecom
  • Economy
  • Explained
  • GDP
  • Health
  • Maps
  • notice
  • science
  • Signs
  • Sizes
  • Uncategorized

Useful Resources

  • Chart Diagram
  • Meme Gif
  • Logo Sign
  • Human Anatomy
  • Graph Diagram
  • Economy GDP
  • Twitter
Copyright © 2025 Ygraph. All Rights Reserved.
Theme: Catch Box by Catch Themes
Scroll Up
WP Twitter Auto Publish Powered By : XYZScripts.com