Movie Rating System Explained

Movie rating system explained

Movie rating system indicates which movies are safe to watch for children and teenagers. G rating is safe for all audiences. PG rating indicates some parenta guidance may be requires for certain topics raised in the movie. PG-13 rating shows that some material may be inappropriate for kids under 13.

R movie rating stands for Restricted and there will be some Adult material that parents need to be mindful of. Finally, NC-17 is the strictest film rating with no kids admitted.

What to do in free time

What do I do in free time? You can read a book, write down your goals, write a diary or simply write down your ideas to put and organize your thoughts on paper. You can learn a productive skill that will save you time or help you later.

Free time is also good for exercizing (e.g. going for a walk or a jog outside) or meditating. Above image summarizes some of these spare time ideas.

Submit Diagram

Please complete the required fields.
Please select your image(s) to upload.

Web 2.0 vs Web 3.0 explained

Web 2.0 focused on interaction and community development with network owning the data and introduction of various web applications.

Web 3.0 on the other hand focused on decentralization with higher proportion of AI amd smart applications.

This web 2.0 vs web 3.0 diagram explains the difference.

Europe population projection 2100

By 2100, Europe is expected to face population decline and significant aging. Many countries will have shrinking labor forces and growing dependency ratios, prompting shifts in immigration policies, pension systems, and healthcare infrastructure to address demographic imbalances.

Europe population projection 2100

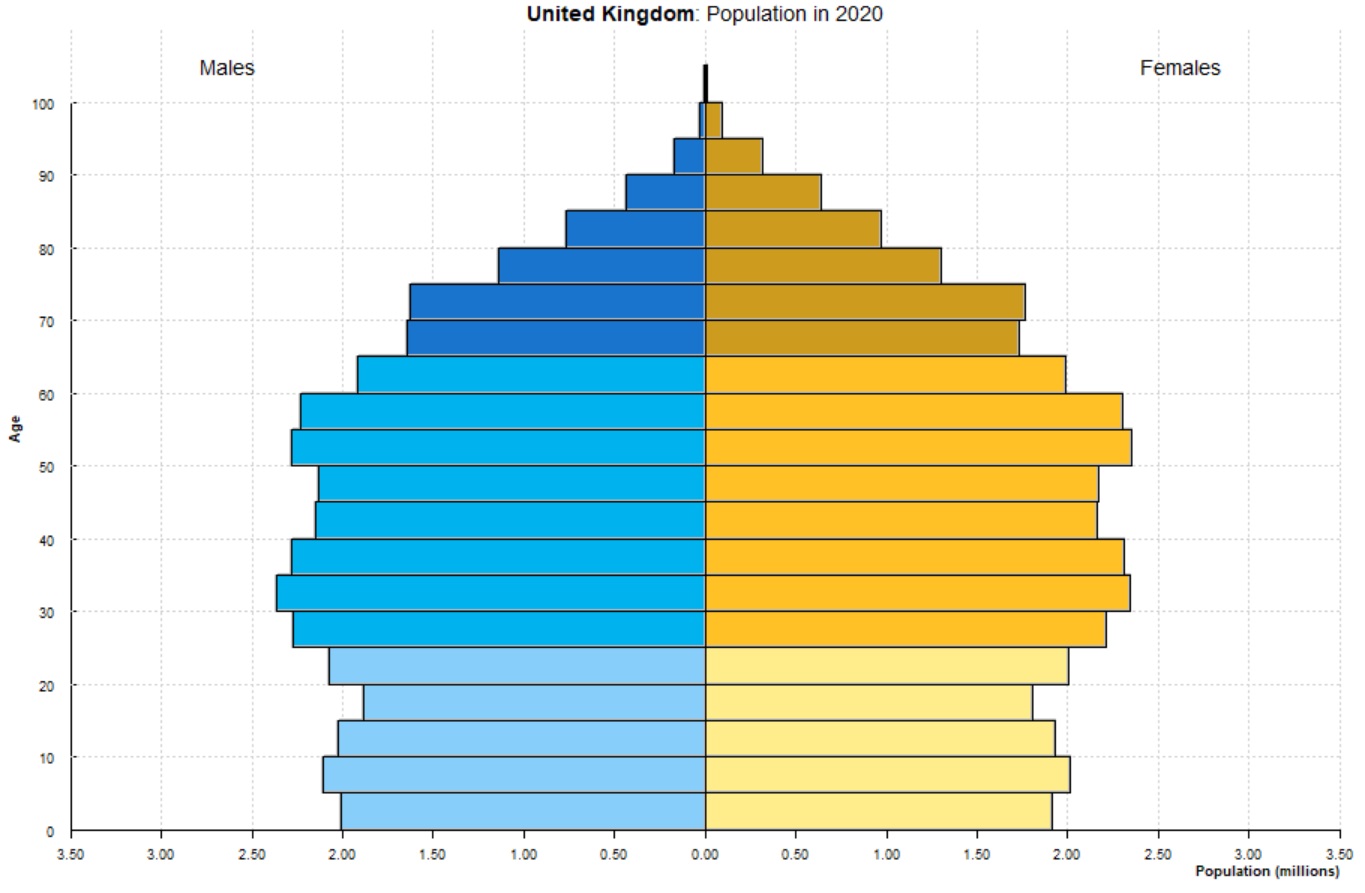
United Kingdom population pyramid

The population pyramid of the United Kingdom displays a classic aging society structure, with a narrowing base of younger age groups and an expanding proportion of older adults. This trend is driven by sustained low fertility rates and increased life expectancy. The demographic profile raises concerns about future labor force shortages and the strain on pension and healthcare systems.

United Kingdom population pyramid

Europe population pyramid

The population pyramid of Europe reveals a clear aging trend, with a large proportion of the population concentrated in older age brackets and a narrowing base of younger cohorts. This demographic structure reflects decades of low fertility rates and increased life expectancy. Many European countries are now focused on addressing the economic and social implications of an aging population.

Europe population pyramid

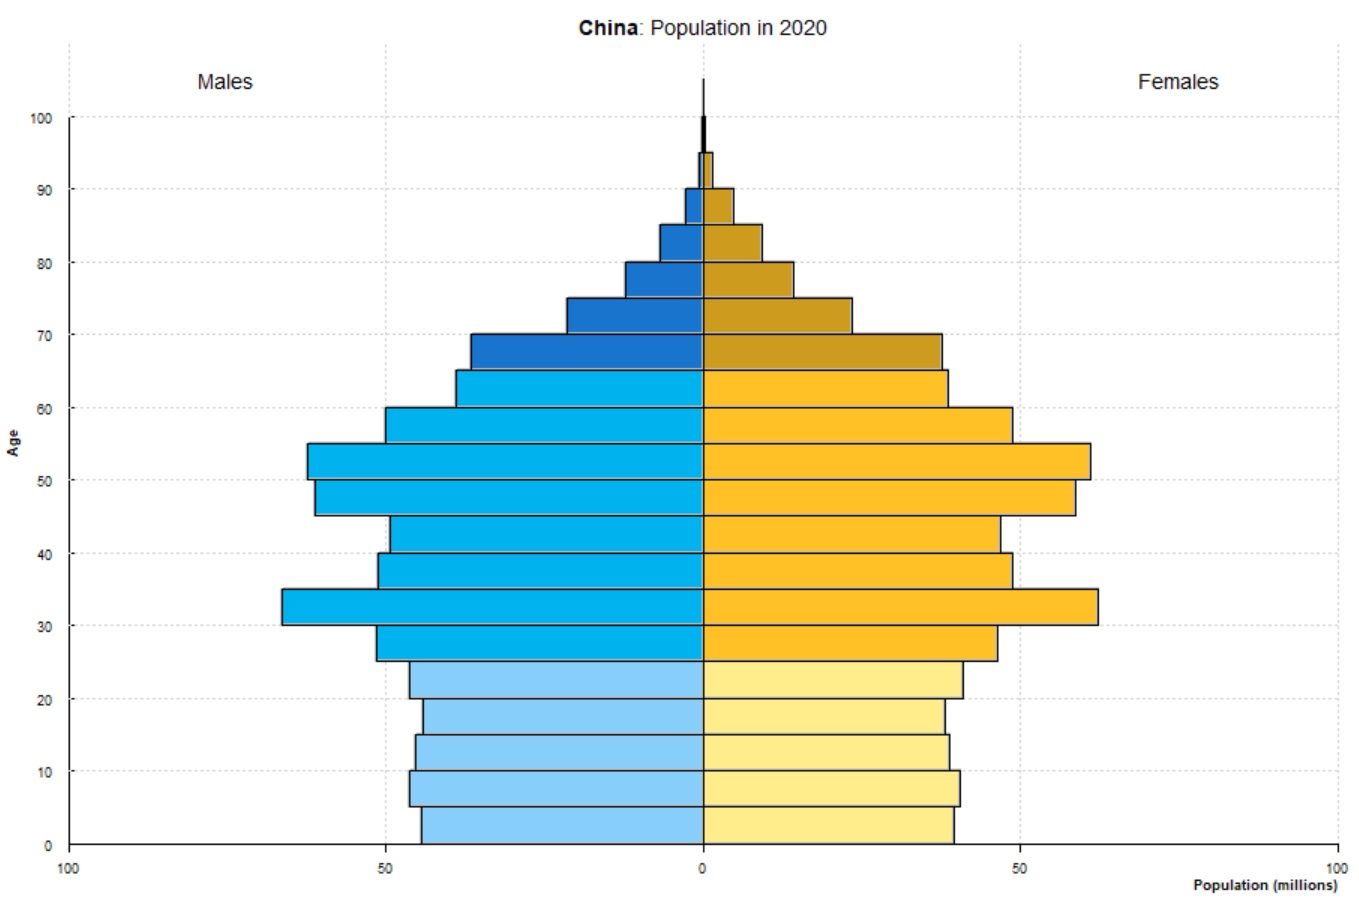
China population pyramid

China’s population pyramid shows a rapidly aging structure, with a shrinking base of young people and a bulging segment of middle-aged and older adults. This demographic profile results from decades of low fertility and improved longevity. The imbalance between working-age and dependent populations is expected to grow more pronounced in the future.

China population pyramid

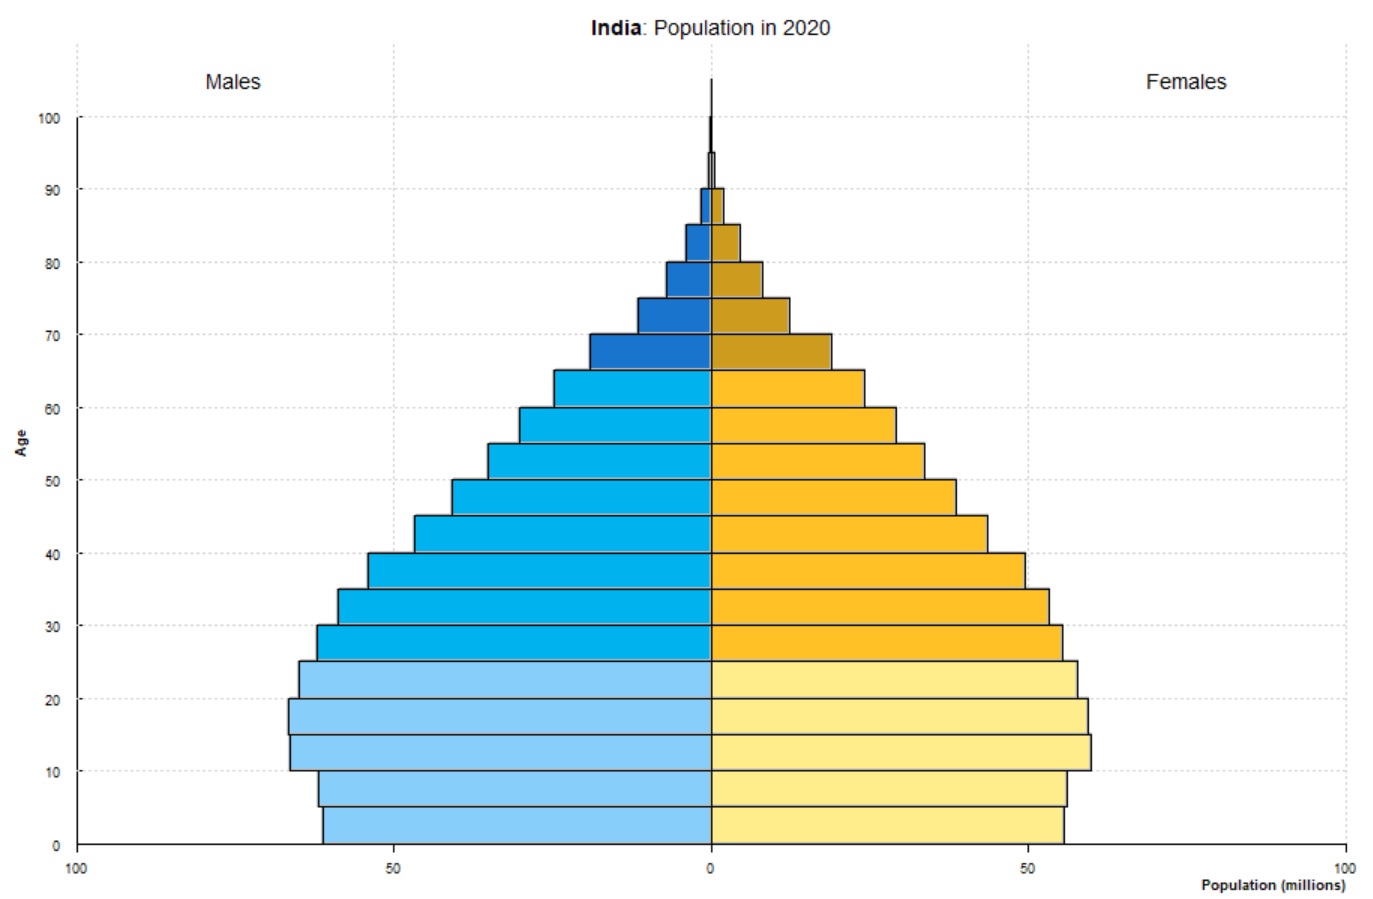
India population pyramid

India’s population pyramid is broad at the base, reflecting a large youth population, though fertility rates are declining. The structure shows a gradual demographic transition with longer life expectancy and a narrowing base as birth rates fall, indicating future aging and shifts in dependency ratios.

India population pyramid