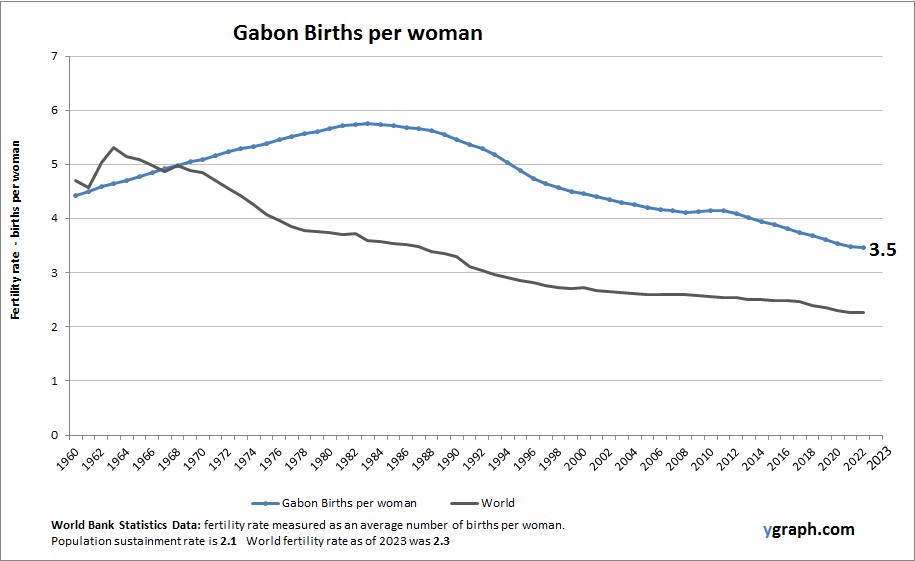
Dominican Republic Population

The above graph shows Dominican Republic Population. This is according to World Bank total population stats. Based on the latest available information for Dominican Republic.

The Dominican Republic has a growing population fueled by moderate fertility rates and a youthful age structure. Urbanization is increasing, particularly in Santo Domingo, contributing to economic development and demographic shifts. Healthcare improvements and education access support gradual declines in birth rates.

Dominican Republic Population

Slovakia Population

Chart above demonstrates Slovakia Population. World Bank is the source of this population data. Based on the latest available information for Slovakia.

Slovakia has a stable but slowly declining population influenced by low fertility rates and emigration. Urban centers experience moderate growth, while rural areas see decline. Economic transition and integration within the European Union affect migration and demographic patterns. Policies aim to address aging and support family growth.

Slovakia Population

Lebanon Population

The above graph shows Lebanon Population. This is according to World Bank total population stats. Based on the latest available information for Lebanon.

Lebanon has a complex and diverse population with slow growth, low fertility rates, and significant emigration driven by political instability and economic challenges. Urban areas like Beirut are densely populated, while demographic shifts are influenced by sectarian dynamics and refugee inflows. Aging and youth unemployment are key concerns shaping policy discussions.

Lebanon Population

Bosnia and Herzegovina Population

The above graph shows Bosnia and Herzegovina Population. This is according to World Bank total population stats. Based on the latest demographics info provided for Bosnia and Herzegovina.

Bosnia and Herzegovina has a declining and aging population influenced by low fertility rates and significant emigration. The country’s complex ethnic composition and post-conflict recovery affect migration and demographic stability. Urban centers maintain population levels better than rural areas, where decline is more pronounced. Economic challenges and political fragmentation impact demographic policies.

Bosnia and Herzegovina Population

Equatorial Guinea Population

Chart above demonstrates Equatorial Guinea Population. World Bank is the source of this population data. Based on the latest demographics info provided for Equatorial Guinea.

Equatorial Guinea has a small but growing population characterized by high fertility rates and a youthful age structure. Economic wealth from oil has fueled urban growth, particularly in the capital Malabo, but demographic challenges include uneven access to healthcare and infrastructure outside urban centers.

Equatorial Guinea Population

Liberal Political Spectrum

Liberal Political Spectrum: The liberal political spectrum generally advocates for social equality, individual rights, and government intervention in the economy to promote social welfare. Liberals support progressive reforms, environmental protection, and policies that address social injustices.

Liberal Political Spectrum

Life History Diagram 92

Another life history diagram explaining the course of human history.

Life History Diagram 92

Ukraine Population

The above graph shows Ukraine Population. The country statistics are compiled by World Bank. Based on the latest available information for Ukraine.

Ukraine’s population has been shrinking due to low fertility, high mortality, and significant emigration, especially among younger cohorts. The war and ongoing economic instability have accelerated these trends. The population is aging rapidly, and the demographic outlook poses serious challenges for reconstruction, labor force planning, and healthcare systems.

Ukraine Population