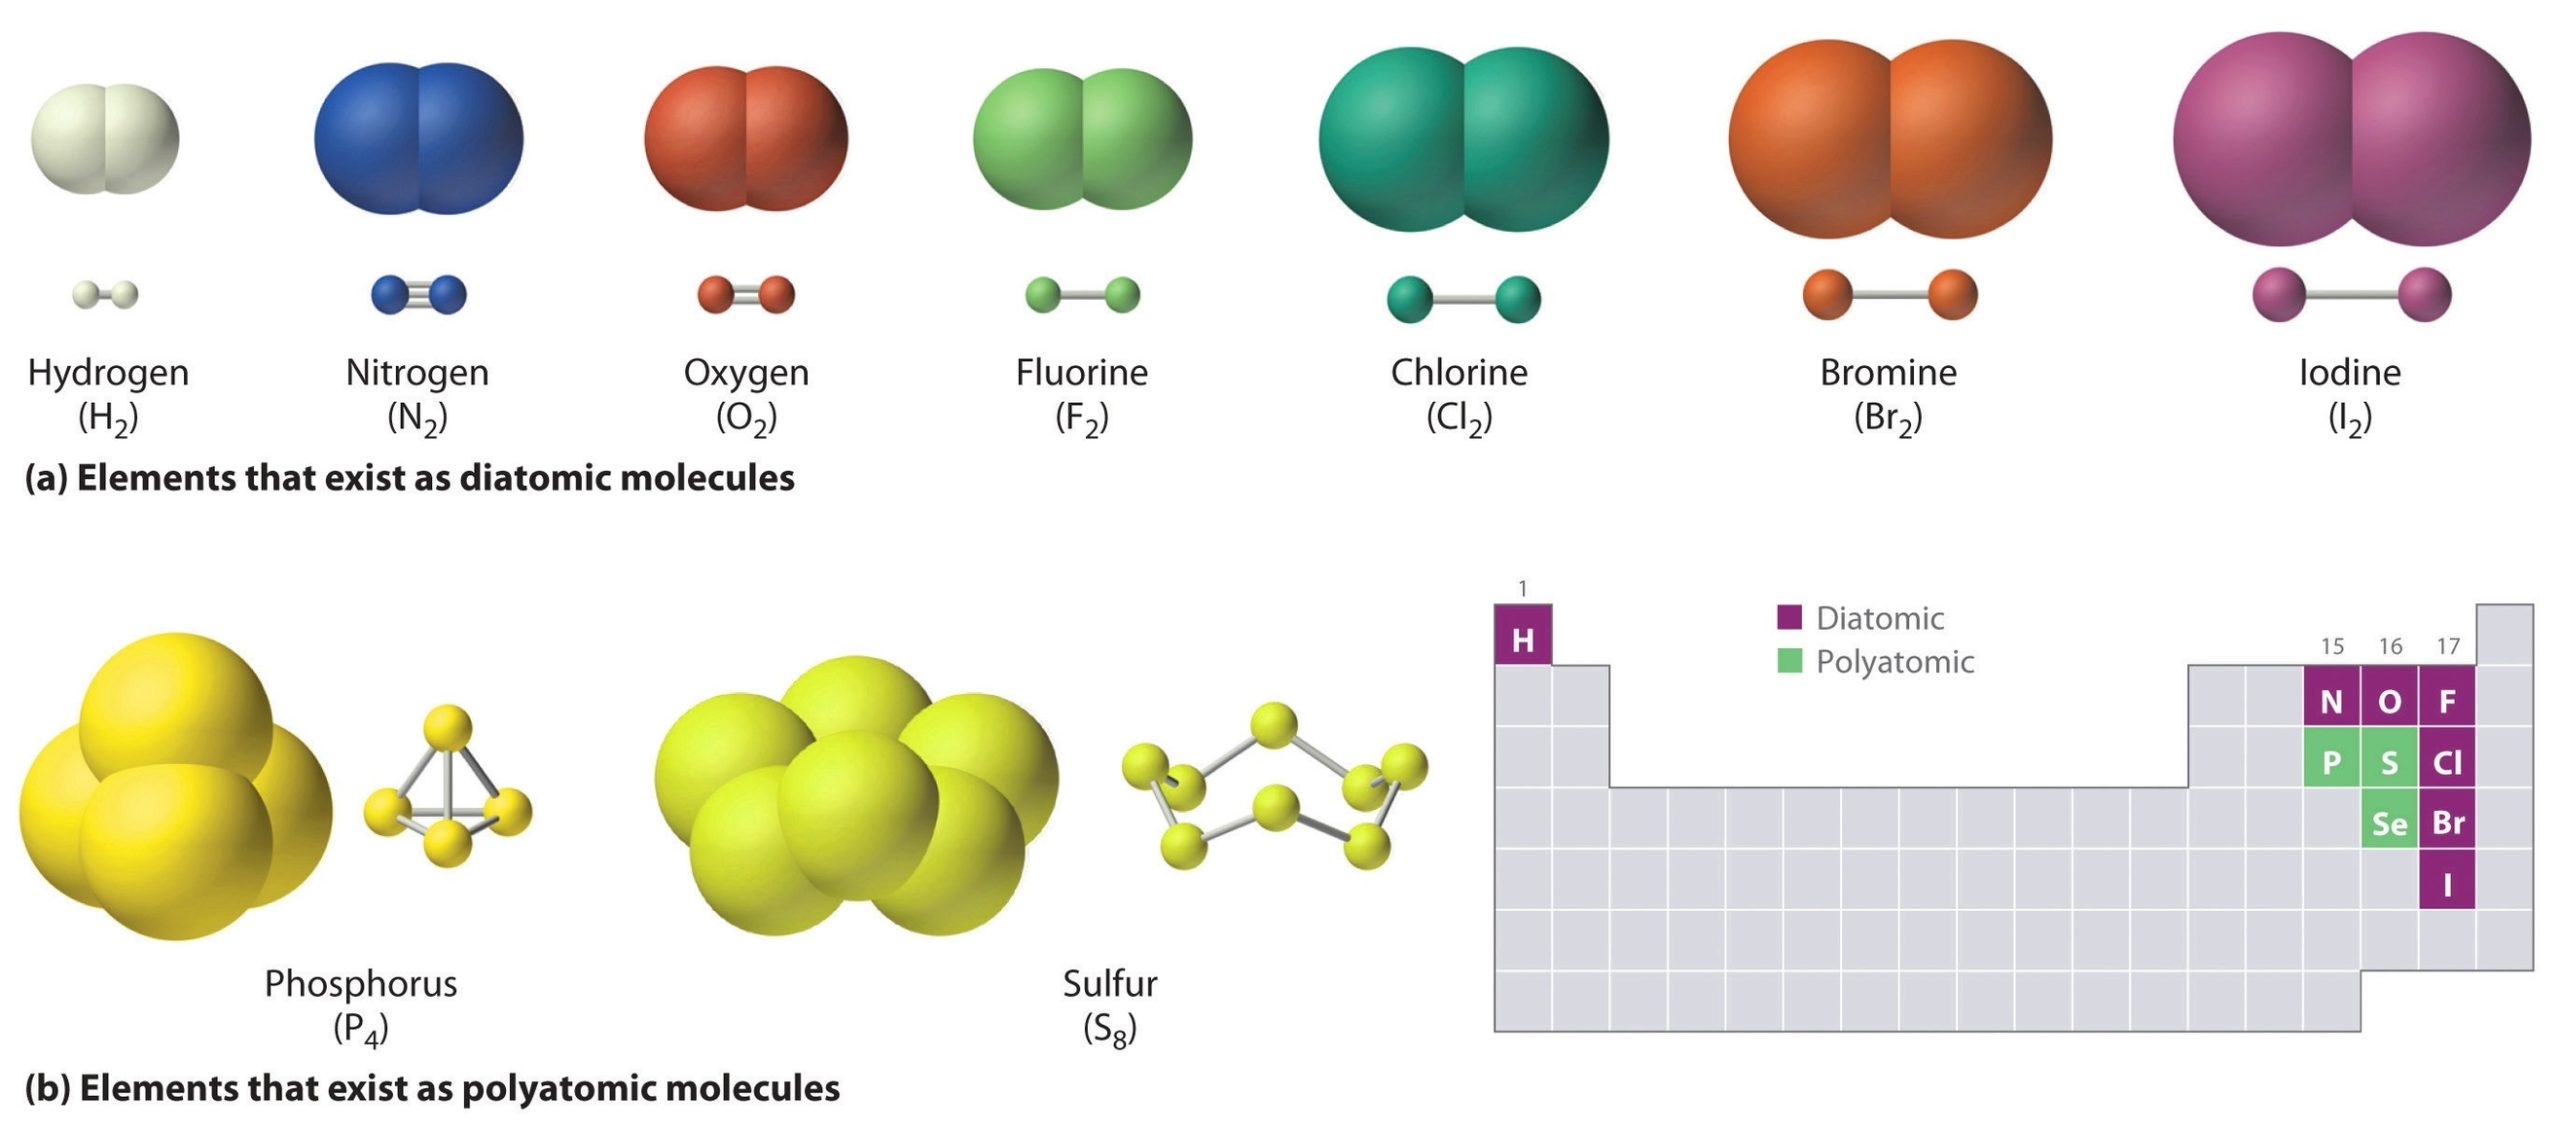
Biology Diagrams Example

Biology Diagrams Example: Biology diagrams are essential tools for visualizing complex biological processes and structures. Examples include the anatomy of a flower, the structure of an animal cell, and the process of photosynthesis in leaves. These diagrams help students and researchers understand and communicate intricate details of living organisms.

Biology Diagrams Example

Lower middle income Population

Chart above demonstrates Lower middle income Population. World Bank is the source of this population data. Latest population information for Lower middle income.

Countries in the lower-middle-income category typically experience moderate to high fertility rates, younger populations, and fast urbanization. These regions are in various stages of demographic transition, balancing development goals with the pressures of rapid population growth.

Lower middle income Population

Russia Population

Chart above demonstrates Russia Population. The country statistics are compiled by World Bank. Based on the latest available information for Russia.

Russia faces a declining and aging population, with fertility rates consistently below replacement level. Efforts to boost birth rates through financial incentives and family support have had limited long-term impact, while emigration and low life expectancy also affect demographic trends.

Russia Population

Namibia Births per woman

This diagram presents Namibia Births per woman. This is according to World Bank birth stats by country. Based on the latest available information for Namibia.

Namibia maintains moderate fertility rates, with a declining trend due to urbanization, education improvements, and enhanced access to family planning. The population is young, and health challenges persist in some rural areas. Economic development and social policies aim to address population growth and promote sustainable development.

Namibia Births per woman

Kenya Population

This diagram presents Kenya Population. World Bank is the source of this population data. Based on the latest available information for Kenya.

Kenya has a large and fast-growing population, driven by high birth rates and a significant youth demographic. Urbanization is accelerating, and while fertility is gradually declining, population momentum ensures continued growth in coming decades, posing both opportunities and challenges for development.

Kenya Population

British Virgin Islands Population

This diagram presents British Virgin Islands Population. World Bank is the source of this population data. Based on the latest available information for British Virgin Islands.

The British Virgin Islands have a small population that fluctuates with migration trends and tourism-driven economic activity. Fertility rates are moderate, and the demographic structure is shaped by both native islanders and expatriates seeking economic opportunities.

British Virgin Islands Population

Chemistry Experiment Illustration

Chemistry Experiment: A chemistry experiment is a scientific procedure conducted to investigate chemical reactions, properties, or phenomena. Experiments involve forming hypotheses, conducting controlled tests, observing results, and drawing conclusions. They are fundamental to advancing knowledge in chemistry.

Chemistry Experiment Illustration

European Union Population

This diagram presents European Union Population. World Bank is the source of this population data. Based on the latest demographics info provided for European Union.

The European Union has a large population characterized by low fertility rates and an aging demographic. Population growth is largely driven by immigration. Urbanization is widespread, and member states face challenges related to workforce sustainability, social welfare, and integration of migrants. Policies aim to balance demographic trends with economic growth and social cohesion.

European Union Population

Assessment Flow Chart

Assessment Flow: Assessment flow refers to the systematic process of evaluating a subject or situation. It involves steps such as data collection, analysis, interpretation, and reporting. This flow ensures that assessments are organized, comprehensive, and yield actionable insights.

Assessment Flow Chart

West Bank and Gaza Population

The above graph shows West Bank and Gaza Population. The country statistics are compiled by World Bank. Based on the latest demographics info provided for West Bank and Gaza.

The West Bank and Gaza have a young and rapidly growing population with high fertility rates. Political and economic challenges influence demographic trends, while urbanization and migration affect population distribution and growth patterns.

West Bank and Gaza Population