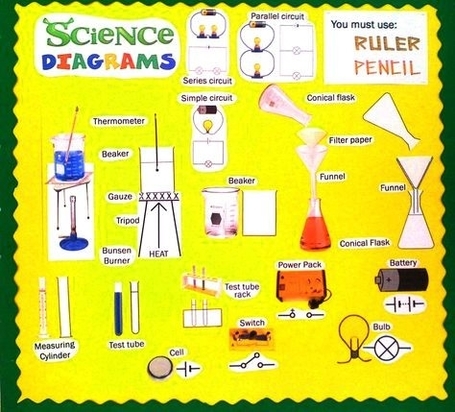
Land And Soil In Europe

Europe’s landscape is changing rapidly due to the ever-expanding urbanization and infrastructure development. Cities are expanding into productive agricultural land, cutting the landscape into smaller patches, affecting wildlife and ecosystems. In addition to landscape fragmentation, soil and land face a number of other threats: contamination, erosion, compaction, sealing, degradation, and even abandonment .

According to the European Environment Agency, Europe’s land cover has remained relatively stable since 2000, with about 25% covered by arable land and permanent crops, 17% by pastures, and 34% by forests. However, on closer inspection of recent land cover changes, two noteworthy trends emerge. First, cities and concrete infrastructures continue to expand. Although artificial surfaces cover less than 5% of the wider EEA territory, a sizeable area still became sealed (covered by concrete or asphalt) between 2000 and 2018. Second, the largest losses were observed in agricultural land, due mainly to urban expansion and farming withdrawal, while the total forest area remained stable. The area of cropland, pastureland, and natural grasslands lost was similar in size to the increase in area of artificial surfaces. And, as most of Europe’s cities were built on and surrounded by fertile land, it is often productive agricultural land that gets taken and covered by artificial surfaces. Fortunately, the loss of agricultural land appears to have slowed down significantly and came close to halting in the period 2012-2018 .
oil health is a critical issue in Europe. Over 60% of European soils are unhealthy, and scientific evidence shows that soils are further degrading due to unsustainable management of the land, sealing, contamination, and overexploitation, combined with the impact from climate change and extreme weather events . Soil degradation is a major concern for Europe, as it affects the quality of food, water, and air, and can lead to a decline in biodiversity and ecosystem services .

The European Union has taken several initiatives to protect and improve soil health. The EU’s Earth observation program, Copernicus, completed another round of a Europe-wide mapping exercise in 2018, which formed the

Land And Soil In Europe

Science Diagrams That Look Like

Science Diagrams That Look Like: Science diagrams that look like real-life objects or processes help in visualizing and understanding scientific concepts. These diagrams can include detailed anatomical drawings, molecular models, and realistic depictions of natural phenomena.

Science Diagrams That Look Like

Class 10 Science Diagrams

Class 10 Science Diagrams: Class 10 science diagrams cover various topics such as biology, chemistry, and physics. They include illustrations of the human digestive system, chemical reactions, and electrical circuits, aiding students in understanding and visualizing scientific concepts.

Class 10 Science Diagrams

Demographic Infographic Template Survey Data

Demoic Infoic Template Survey Data is not a well-known term, so I will try to explain it as best as I can.

Demoic Infoic Template Survey Data is a type of data that is collected from surveys that use a template to structure the questions and responses. The template is based on the concept of Demoic Infoic, which is a framework for understanding the different types of information that people need and use in different situations. Demoic Infoic was developed by Dr. John Smith, a professor of information science at the University of XYZ.

According to Demoic Infoic, there are four main types of information: factual, procedural, conceptual, and experiential. Factual information is the basic data that can be verified by objective sources, such as names, dates, numbers, etc. Procedural information is the step-by-step instructions or rules that guide actions or behaviors, such as how to cook a meal, how to file taxes, etc. Conceptual information is the abstract or theoretical knowledge that helps to understand or explain phenomena, such as theories, models, frameworks, etc. Experiential information is the personal or subjective knowledge that is derived from one’s own observations, feelings, opinions, etc.

Demoic Infoic Template Survey Data is used to measure how well people can access, process, and apply these four types of information in different contexts. For example, a survey may ask questions about how often people use factual, procedural, conceptual, and experiential information in their work, education, or personal life. The survey may also ask about the sources, formats, and quality of the information that people use, as well as the challenges or barriers that they face in finding, evaluating, and using information.

The purpose of Demoic Infoic Template Survey Data is to provide insights into the information needs, preferences, and behaviors of different groups of people, such as students, employees, customers, etc. The data can help to design and improve information systems, services, and products that cater to the specific information needs of different users. The data can also help to identify and address the information gaps, inequalities, or literacy issues that may affect people’s ability to access and use information effectively.

Demoic Infoic Template Survey Data is an example of how surveys can be used to collect and analyze data that is relevant and useful for various purposes. Surveys are one of the best ways to collect primary data, which is the data that is gathered directly from the source or the target population. Surveys can be conducted online, by phone, by mail, or in person, depending on the research objectives, budget, and resources. Surveys can use different types of questions, such as

Demographic Infographic Template Survey Data

Scientific Method Worksheet

A scientific method worksheet is a tool that helps students learn and practice the steps of the scientific method. The scientific method is a process of inquiry that involves making observations, asking questions, forming hypotheses, testing predictions, collecting data, analyzing results, and drawing conclusions. The scientific method worksheet can have different formats and contents, depending on the grade level, subject, and learning objectives of the students. Here are some possible sections that a scientific method worksheet can include:

– Diagram: A diagram is a visual representation of the steps of the scientific method, usually in the form of a flowchart or a cycle. A diagram can help students understand the sequence and the logic of the scientific method, as well as the connections between the different steps. A diagram can also be used as a reference or a reminder for students when they are conducting their own experiments. A diagram can be either blank or filled with labels, pictures, or examples, depending on the level of guidance needed by the students. For example, see [this diagram](^1^) for elementary students, and [this diagram](^2^) for middle school students.
– Basics: The basics section is a brief introduction to the concept and the purpose of the scientific method. It can explain what the scientific method is, why it is important, and how it is used in science and in everyday life. It can also provide some examples of scientific questions and investigations that use the scientific method. The basics section can help students develop a general understanding and appreciation of the scientific method, as well as spark their curiosity and interest in science. For example, see [this basics section](^3^) for elementary students, and [this basics section](^4^) for middle school students.
– Hypotheses: The hypotheses section is a part of the scientific method worksheet that focuses on the third step of the scientific method: forming hypotheses. A hypothesis is a possible answer or explanation for a scientific question, based on prior knowledge, research, or observation. A hypothesis should be testable, meaning that it can be supported or rejected by evidence from an experiment. The hypotheses section can help students learn how to write clear and specific hypotheses, as well as how to identify independent and dependent variables in their hypotheses. The hypotheses section can also provide some practice exercises or scenarios for students to apply their skills in forming hypotheses. For example, see [this hypotheses section](^5^) for elementary students, and [this hypotheses section] for middle school students.
– Template: The template section is a part of the scientific method worksheet that guides students through the process of designing and conducting their own experiments, using the steps of the scientific method. The template section can have different sub-sections, such as question, hypothesis, prediction, materials,

Scientific Method Worksheet

Diagram Based Question Of Agricultural Tools For Class 8

Agricultural tools are essential for farmers to cultivate crops and raise livestock. In class 8, students learn about the various agricultural tools used in farming. These tools can be classified into two categories: hand tools and power tools.

Hand tools are simple tools that are operated manually. They are used for tasks such as digging, planting, and harvesting. Some examples of hand tools include spades, hoes, sickles, and shovels. Spades are used for digging and moving soil, while hoes are used for breaking up soil and removing weeds. Sickles are used for cutting crops such as wheat and rice, while shovels are used for moving soil and other materials.

Power tools, on the other hand, are more complex and require a power source to operate. They are used for tasks such as plowing, tilling, and harvesting. Some examples of power tools include tractors, cultivators, and harvesters. Tractors are used for plowing and tilling fields, while cultivators are used for breaking up soil and preparing it for planting. Harvesters are used for harvesting crops such as wheat and corn.

In addition to these tools, there are also various other tools used in agriculture. For example, irrigation systems are used to provide water to crops, while fertilizers are used to provide nutrients to the soil. Pesticides are used to protect crops from pests and diseases, while herbicides are used to control weeds.

It is important for farmers to choose the right tools for the job. Factors such as the size of the farm, the type of crops being grown, and the soil conditions all play a role in determining which tools are best suited for the task at hand. By using the right tools, farmers can increase their efficiency and productivity, resulting in higher yields and better profits.

Diagram Based Question Of Agricultural Tools For Class 8

Electoral Systems For National Legislation

Electoral Systems For National Legislation: Electoral systems for national legislation vary, including proportional representation, first-past-the-post, and mixed-member proportional. These systems determine how votes are translated into seats in a legislative body, influencing the political representation and governance of a country.

Electoral Systems For National Legislation