Mongolia Population

The above graph shows Mongolia Population. This is according to World Bank total population stats. Based on the latest demographics info provided for Mongolia.

Mongolia has a small population spread over a vast territory, with moderate fertility rates. Urban migration to Ulaanbaatar has increased, shaping demographic patterns and putting pressure on city infrastructure.

Mongolia Population

Computer Science Diagram

Computer Science Diagram: A computer science diagram is a visual representation used to illustrate algorithms, processes, or systems within the field of computer science. Common types include flowcharts, state diagrams, and system diagrams, which help in understanding and designing complex systems.

Computer Science Diagram

Physics Definition, Branches And Importance

Physics Definition, Branches And Importance: Physics is the study of matter, energy, and the fundamental forces of nature. Its branches include classical mechanics, electromagnetism, thermodynamics, quantum mechanics, and relativity. Physics is essential for understanding the natural world and developing new technologies.

Physics Definition, Branches And Importance

Gibraltar Births per woman

Chart above demonstrates Gibraltar Births per woman. The fertility rate statistics are compiled by World Bank. Based on the latest demographics info provided for Gibraltar.

Gibraltar has low fertility rates typical of highly developed urbanized areas. Population growth is slow and influenced by migration related to its economic and geopolitical status. The territory’s small size and dense population shape demographic patterns, with efforts to maintain social services and infrastructure.

Gibraltar Births per woman

Botswana Population

Chart above demonstrates Botswana Population. World Bank is the source of this population data. Based on the latest demographics info provided for Botswana.

Botswana has a growing population with a relatively young age structure, shaped by moderate fertility rates and improvements in healthcare. Urbanization is increasing, particularly in the capital Gaborone, while rural areas still retain significant population shares. Economic development and HIV/AIDS management influence demographic dynamics.

Botswana Population

R Venn Diagram

R Venn is a term that refers to the use of R programming language to create Venn diagrams. Venn diagrams are graphical representations of the logical relations between different sets of data. They consist of overlapping circles, where each circle represents a set and the overlapping regions represent the intersections of the sets.

There are several R packages that can help you create Venn diagrams with different features and styles. Some of the most popular ones are:

– ggvenn: This package is a ggplot2 extension that allows you to create Venn diagrams using the grammar of graphics. You can customize the fill color, stroke size, and set name size of each circle. You can also use the ggplot2 functions to add titles, labels, and legends to your plot.
– ggVennDiagram: This package is another ggplot2 extension that maps the fill color of each region to the quantity of the data. This way, you can visually observe the differences between different parts of the Venn diagram. You can also adjust the label size, position, and alpha of each region.
– VennDiagram: This package provides functions to create Venn diagrams with up to five sets. You can specify the area size, cross area size, and category names of each set. You can also change the fill color, line width, line type, and font face of each circle. You can save your Venn diagram as a file or display it directly in R.
– gplots: This package provides a function called venn() that takes a list of sets as input and returns a table of the intersection data. You can use this table to create a Venn diagram with the plot() function. You can also access the intersection data for further analysis.

To use any of these packages, you need to install and load them first. Then, you need to prepare your data as a list of sets, where each set is a vector of values. For example, you can create a list of four sets of genes as follows:

“`r
set.seed(20210110)
genes <-

R Venn Diagram

Geographic Information System

A Geographic Information System (GIS) is a computer system that captures, stores, analyzes, and displays data related to positions on Earth’s surface . GIS can be used to map and examine changes on Earth, and it can show many different kinds of data on one map, such as streets, buildings, and vegetation . This enables people to more easily see, analyze, and understand patterns and relationships . GIS technology is a crucial part of spatial data infrastructure, which the White House defines as “the technology, policies, standards, human resources, and related activities necessary to acquire, process, distribute, use, maintain, and preserve spatial data” .

GIS can use any information that includes location. The location can be expressed in many different ways, such as latitude and longitude, address, or ZIP code . Many different types of information can be compared and contrasted using GIS. The system can include data about people, such as population, income, or education level. It can include information about the landscape, such as the location of streams, different kinds of vegetation, and different kinds of soil. It can include information about the sites of factories, farms, and schools, or storm drains, roads, and electric power lines . With GIS technology, people can compare the locations of different things in order to discover how they relate to each other .

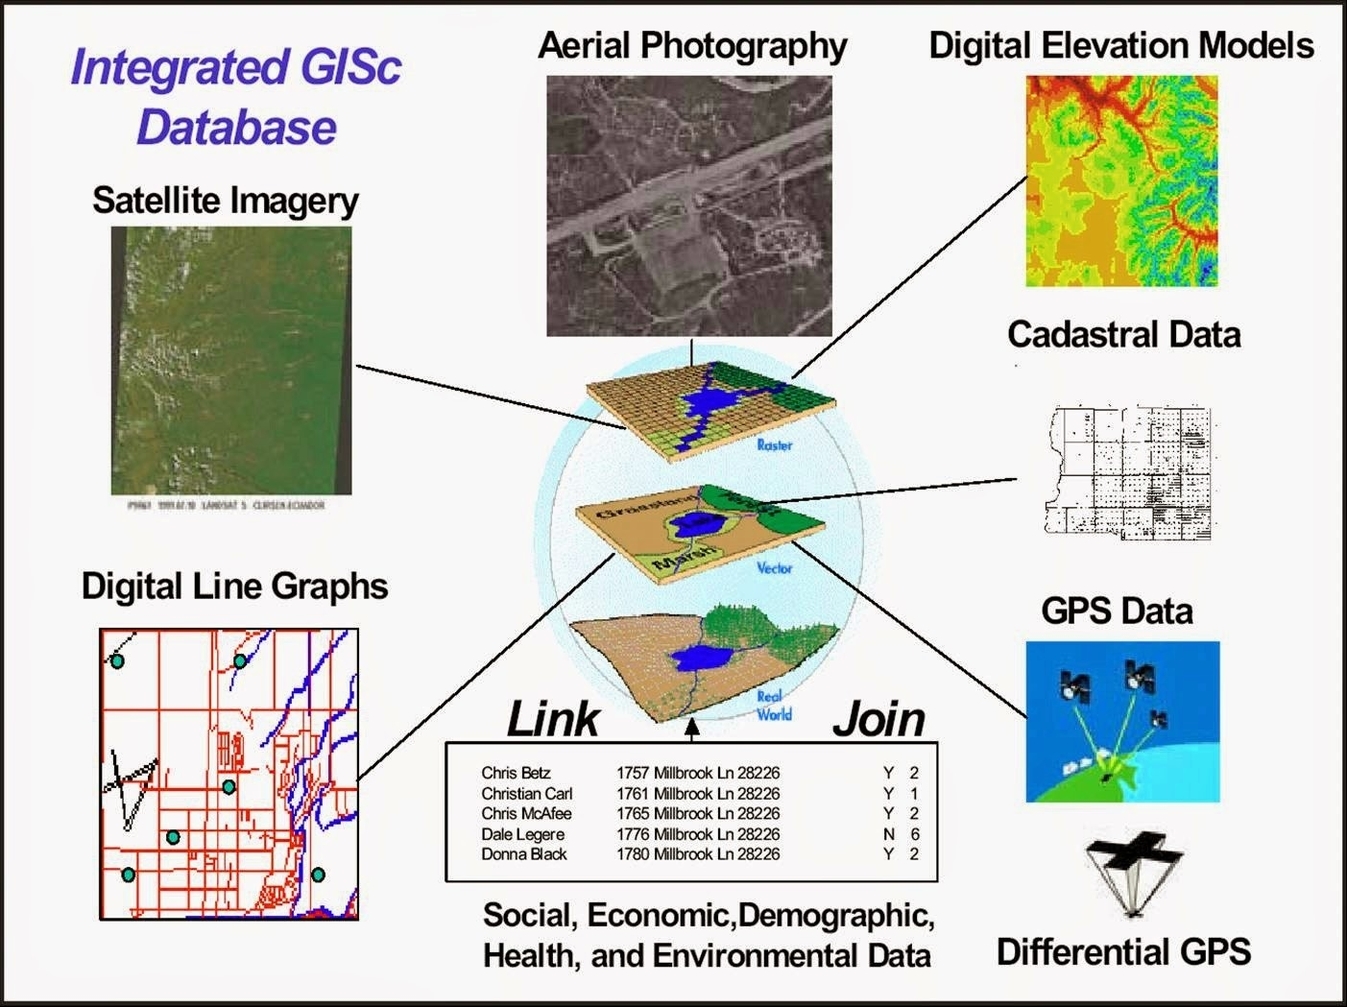
GIS applications include both hardware and software systems. These applications may include cartographic data, photographic data, digital data, or data in spreadsheets . Cartographic data are already in map form, and may include such information as the location of rivers, roads, hills, and valleys . Cartographic data may also include survey data and mapping information that can be directly entered into a GIS . Photographic interpretation is a major part of GIS. Photo interpretation involves analyzing aerial photographs and assessing the features that appear .

In summary, GIS is a powerful tool that allows people to analyze and understand spatial patterns and relationships. It can be used to map and examine changes on Earth, and it can show many different kinds of data on one map. GIS technology is a crucial part of spatial data infrastructure, which is necessary to acquire, process, distribute, use, maintain, and

Geographic Information System

Oman Population

Chart above demonstrates Oman Population. The country statistics are compiled by World Bank. Latest population information for Oman.

Oman’s population is growing steadily, with a notable portion made up of expatriates who contribute to the country’s labor force, especially in construction, oil, and service sectors. The native Omani population is relatively young, and while the fertility rate has declined in recent years, it remains higher than many developed nations. Government investment in health and education is shaping future demographic trends.

Oman Population

Central Europe and the Baltics Births per woman

This diagram presents Central Europe and the Baltics Births per woman. World Bank is the source of this birth data. Based on the latest demographics info provided for Central Europe and the Baltics.

Fertility rates across Central Europe and the Baltics remain below replacement level, despite various family-friendly policies. Economic migration and aging are significant issues, and regional governments are working to incentivize higher birth rates.

Central Europe and the Baltics Births per woman