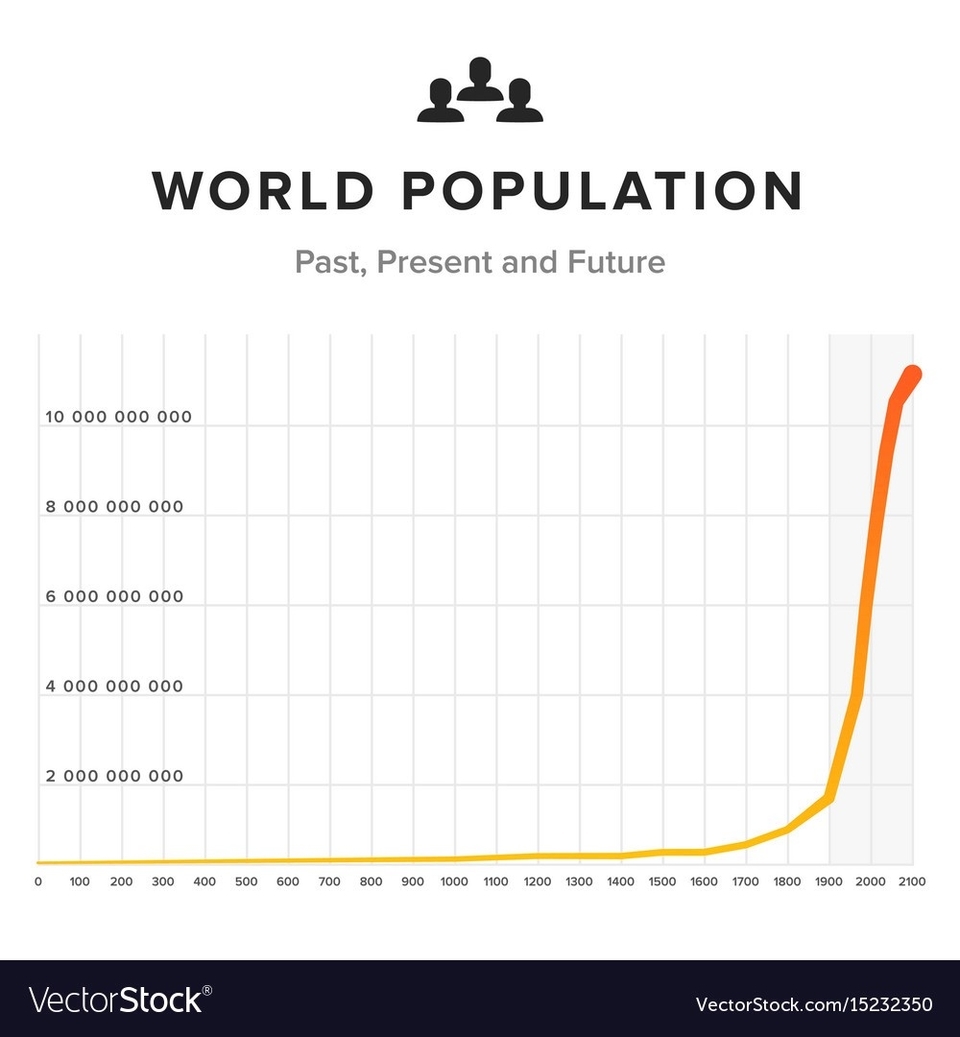
World population is the total number of humans currently living on Earth. According to the United Nations, the world population exceeded eight billion in mid-November 2022. It took around 300,000 years of human prehistory and history for the human population to reach one billion and only 222 years more to reach 8 billion.
The world population is not evenly distributed across the globe. Some regions have much higher densities than others. As of 2024, the most populous country in the world is India, with 1.43 billion people, followed by China, with 1.43 billion people. The United States is the third most populous country, with 340 million people. The least populous countries are mostly small island nations, such as Vatican City, Tuvalu, and Nauru.
The world population is also diverse in terms of age, sex, religion, ethnicity, and other characteristics. The median age of the world population is 30.9 years, meaning that half of the people are younger and half are older. The sex ratio is 101 males per 100 females, meaning that there are slightly more men than women. The largest religion in the world is Christianity, with 2.4 billion followers, followed by Islam, with 1.9 billion followers. The most spoken language in the world is Mandarin Chinese, with 1.1 billion speakers, followed by English, with 983 million speakers.
The world population is constantly changing due to natural and human factors. The natural factors include births, deaths, and migrations. The human factors include policies, wars, disasters, and development. The world population growth rate is the difference between the number of births and the number of deaths per year, expressed as a percentage. The current world population growth rate is 0.88%, meaning that the world population increases by about 71 million people every year. However