Precision agriculture is a scientific management strategy that employs detailed, site-specific information to precisely manage production inputs based on variability to replace average inputs in the field . Crop sensing is an effective technology to understand the variability. In the past decades, a number of crop sensors or instruments based on spectroscopy have been developed and applied to satisfy the requirements and solve detecting problems in the field . These instruments can be used in multiple types, such as handheld detection, vehicle-mounted diagnosis, and remote sensing by UAV or satellites . Typical sensors and specific applications are summarized to explain the application fundamental and potential of crop sensing. These spectral sensors include hyper-spectrometers, multiband sensors for vegetation indices, and imagery instruments using visible or extended spectral bands .
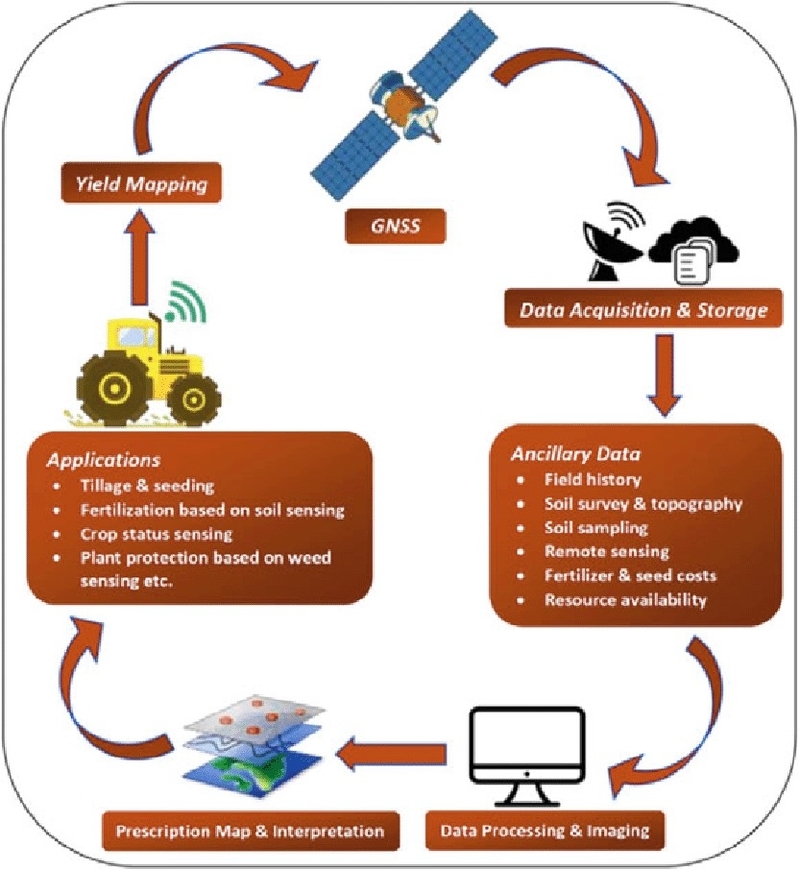
In general, there are three main steps in precision crop management including soil and crop sensing, decision-making, and variable-rate application . One of the critical issues in precision agriculture is how to measure crop growth data noninvasively and efficiently . Flow depicting precision agriculture in crop production is a process that involves the use of remote sensing and geographic information system (GIS) to improve the efficiency of farm management inputs, increase crop productivity or quality, and reduce transport of fertilizers and pesticides beyond the edge of a field . The flow diagram depicting precision agriculture in crop production is shown below:

The flow diagram shows that the first step in precision agriculture is to collect data using remote sensing and GIS . The data collected includes soil and crop information, weather data, and other relevant information . The second step is to analyze the data to identify the variability in the field . This step involves the use of various tools such as statistical analysis, machine learning, and other data analysis techniques . The third step is to make decisions based on the analyzed data . This step involves the use of decision support systems (DSS) to provide recommendations on the optimal use of inputs such as fertilizers, pesticides, and water . The fourth step is to apply the inputs using variable-rate application technology . This technology allows for the precise application of inputs based on the variability in the field . The final step is to monitor the results of the inputs applied and collect data for the next cycle of precision agriculture .
In conclusion, flow depicting precision agriculture in crop production is a process that involves the use of remote sensing and GIS to improve the efficiency of farm management inputs, increase crop productivity or quality, and reduce transport of fertilizers and pesticides beyond the edge of a field. The process involves five main steps including data collection, data analysis, decision-making, variable-rate application, and monitoring. The use of precision agriculture has the potential to revolutionize crop production by reducing the use of inputs, increasing yields, and improving the quality of crops ..