Skip to content
cropped logo

Ygraph

Charts, Graphs and Diagrams

Menu

Primary menu

  • Submit Diagram
  • Science
  • Business
  • Economy
    • GDP
  • Demographics
  • Explained
    • Signs
    • Maps
  • Health
  • Anatomy
  • Sizes

Power Production in the USA. Coal / Natu

Power Production in the USA. Coal / Natural Gas, Nuclear, Hydroelectric share. Source http://www.econgrapher.com/top5graphs22may11.html https://ygraph.com/chart/494

Power Production in the USA. Coal / Natu

Posted in chart, Economy

Commodity Index 1994-2010. On a rolling

Commodity Index 1994-2010. On a rolling 12 month return basis. Source: http://www.econgrapher.com/top5graphs22may11.html https://ygraph.com/chart/493

Commodity Index 1994-2010. On a rolling

Posted in chart, Economy

European Inflation 2000-2011. EU Inflat

European Inflation 2000-2011. EU Inflation Graph. Source: http://www.econgrapher.com/top5graphs22may11.html https://ygraph.com/chart/491

European Inflation 2000-2011. EU Inflat

Posted in chart, Economy

US Mutual Fund Flows. 2007-2011. Sourc

US Mutual Fund Flows. 2007-2011. Source: http://www.econgrapher.com/ https://ygraph.com/chart/490

US Mutual Fund Flows. 2007-2011. Sourc

Posted in chart, Economy

US Consumer Sentiment. 2006-2011. Sour

US Consumer Sentiment. 2006-2011. Source: http://www.econgrapher.com/ https://ygraph.com/chart/489

US Consumer Sentiment. 2006-2011. Sour

Posted in chart, Economy

Japanese International trade. 2006-2011

Japanese International trade. 2006-2011 Source: http://www.econgrapher.com/ https://ygraph.com/chart/488

Japanese International trade. 2006-2011

Posted in chart, Economy

Japan Annual Inflation Rate 2000-2011. S

Japan Annual Inflation Rate 2000-2011. Source: http://www.econgrapher.com/ https://ygraph.com/chart/487
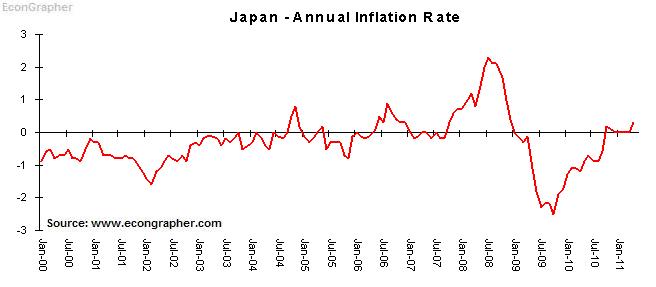
Japan Annual Inflation Rate 2000-2011. S

Posted in chart, Economy

United States GDP Growth. 2001-2010. S

United States GDP Growth. 2001-2010. Source: http://www.econgrapher.com/top5graphs26mar11.html https://ygraph.com/chart/483

United States GDP Growth. 2001-2010. S

Posted in chart, Economy

New USA Economic Forecast Through 2011:

New USA Economic Forecast Through 2011: Stagnanation. Source: http://www.bullfax.com/?q=node-new-economic-forecast-through-2011-stagnant-word-0 https://ygraph.com/chart/481

New USA Economic Forecast Through 2011:

Posted in chart, Economy

Biggest Risks in 2011. European Sovereig

Biggest Risks in 2011. European Sovereign Debt Crisis. Turmoil in the Arab World, rising oil prices. China tightening rates. Japanese Recession. Source: http://www.collegestockpro.com/201104062580/college-stock-pro/biggest-market-risk-middle-east-turmoil/ https://ygraph.com/chart/479

Biggest Risks in 2011. European Sovereig

Posted in chart, Explained

Post navigation

← Older posts
Newer posts →

Primary Sidebar Widget Area

Top Diagrams

Latest Posts

  • How to Stop Time from Flying
  • Political Party Roles
  • Cell Structure
  • Costa Rica Population
  • Rog
  • Geography Termsgeography Vocabulary
  • Economics Diagrameconomic Flow Diagram 6
  • Map Of Philosophy Of History
  • Macroeconomics Circular Flow Diagram
  • Tajikistan Population
  • Free Body Diagram
  • Fjord Formation
  • Guinea Bissau Births per woman
  • Kazakhstan Population
  • Political Process Definition
  • Horseshoe Political Theory

Top Tags

  • sizes (35)
  • size chart (35)
  • size conversion (35)
  • economy chart (33)
  • economy graph (33)
  • economy diagram (33)
  • cell (29)
  • cell diagram (29)
  • cell illustration (29)
  • window (24)
  • window diagram (24)
  • types of windows (24)
  • origami (16)
  • origami steps (16)
  • how to make origami (16)
  • biology (16)
  • biology diagram (16)
  • yoga (8)
  • yoga routine (8)
  • yoga poses (8)

Categories

  • anatomy
  • Business
  • chart
  • Demographics
  • Eco
  • Ecom
  • Economy
  • Explained
  • GDP
  • Health
  • Maps
  • notice
  • science
  • Signs
  • Sizes
  • Uncategorized

Useful Resources

  • Chart Diagram
  • Meme Gif
  • Logo Sign
  • Human Anatomy
  • Graph Diagram
  • Economy GDP
  • Twitter
Copyright © 2025 Ygraph. All Rights Reserved.
Theme: Catch Box by Catch Themes
Scroll Up
WP Twitter Auto Publish Powered By : XYZScripts.com