Offshore Countries Map. Map of countries where to incorporate an offshore company and setup an offshore bank account. Offshore companies chart. BVI, Cyprus, Seychelles, Belize, Bermuda, Hong Kong, Singapore. Source: http://www.aguanegra.net/ https://ygraph.com/chart/649
Offshore Company Structure and Chart. O
Offshore Company Structure and Chart. Offshore trust owns an offshore holding company, which owns offshore trading company and offshore investment company, with an offshore bank account, protection of owner. Source: http://www.setuphkcompany.com/blog/archives/23 https://ygraph.com/chart/647
Offshore Company Structure and Chart. O
Silver Price Chart. Kitco Silver Chart
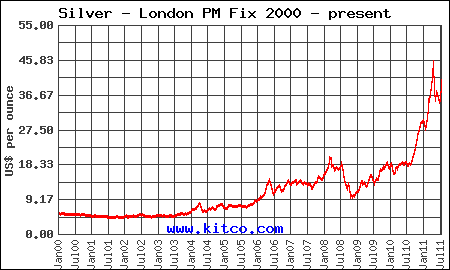
Silver Price Chart. Kitco Silver Chart 2000 – 2011. Silver price growth in past 10 years. Source: http://www.kitco.com/ https://ygraph.com/chart/646
Silver Price Chart. Kitco Silver Chart
Kitco Silver Chart 2011. Silver Price C
Kitco Silver Chart 2011. Silver Price Chart in 2011. Movement of silver prices in 2011 has been volatile. Peak in May. Source: http://www.kitco.com/ https://ygraph.com/chart/644
Kitco Silver Chart 2011. Silver Price C
Envelope Size Chart. Envelopes sizes in
Envelope Size Chart. Envelopes sizes in mm in United Kingdom, Europe, Australia. Source: http://www.clearimages.co.uk/papersizes.html https://ygraph.com/chart/642
Envelope Size Chart. Envelopes sizes in
Envelope Sizes Chart. Envelopes of the
Envelope Sizes Chart. Envelopes of the following sizes: 6×9, 9×12, 10×13. USA, Canada. Source: PrintingHQ envelope sizes
Envelope Sizes Chart. Envelopes of the
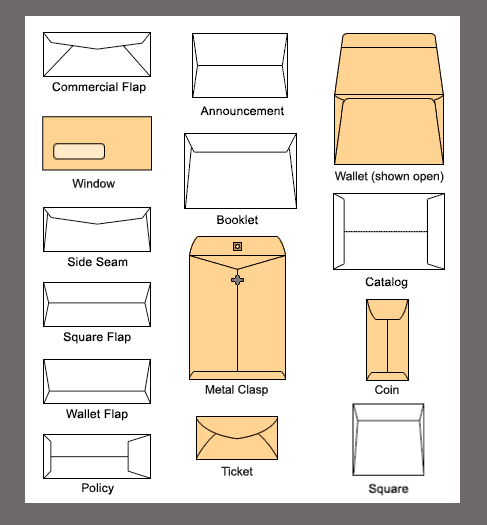
Envelopes sizes, names and types. Source
Envelopes sizes, names and types. Source: http://express-envelopes.com/services https://ygraph.com/chart/638
Envelopes sizes, names and types. Source
Times Table Chart Printable. 15 x 15. Us
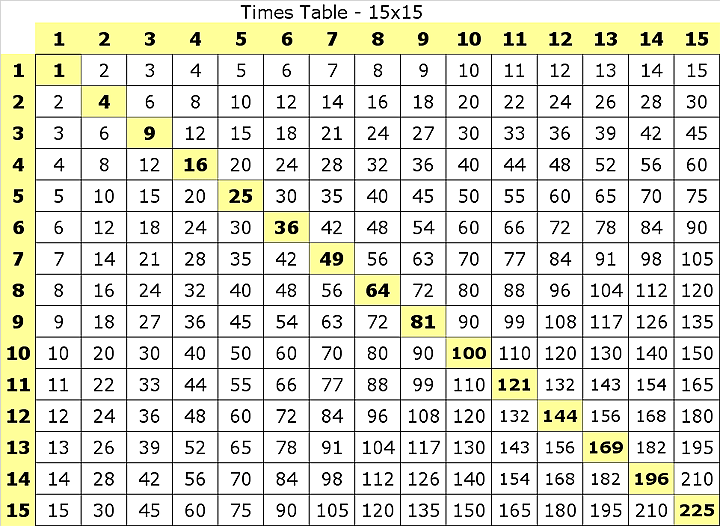
Times Table Chart Printable. 15 x 15. Using times table to calculate multiplication problems. Easy to use times table chart printable. Math times table for kids. times table chart
Times Table Chart Printable. 15 x 15. Us
Times Table Chart. 12 x 12. Using time
Times Table Chart. 12 x 12. Using times table to calculate multiplication problems. Times table chart printable. Source: http://www.vaughns-1-pagers.com/computer/multiplication-tables.htm times table
Times Table Chart. 12 x 12. Using time
PSA Levels Chart: PSA level chart shows
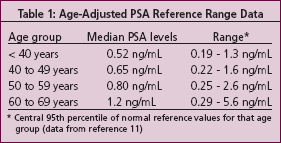
PSA Levels Chart: PSA level chart shows normal psa levels in men depending on age. Monitoring psa levels helps to diagnose and detect prostate cancer. Source: http://www.prostate-cancer.org/pcricms/node/120 https://ygraph.com/chart/633