Map of LA. LA map. Map of Los Angeles, California. L.A. downtown and its neighboring areas. Source: http://www.lonelyplanet.com/maps/north-america/usa/los-angeles/ https://ygraph.com/chart/669
Map of LA. LA map. Map of Los Angeles,

Charts, Graphs and Diagrams
Map of LA. LA map. Map of Los Angeles, California. L.A. downtown and its neighboring areas. Source: http://www.lonelyplanet.com/maps/north-america/usa/los-angeles/ https://ygraph.com/chart/669

Global Cosmetics by Market Share Chart. Asia is the largest market for color cosmetics accounting for 33% of market share. Latin America is expected to exhibit the fastest growth. Source: http://www.yoyolipgloss.com/ir_global_cosmetic_industry.html https://ygraph.com/chart/667

Cosmetics Chart. Cosmetic categories chart. Cosmetics, Fragrances, Skin care, Hair Cair, Men’s grooming, deodorants by share of the industry. Source: http://www.accuval.net/insights/industryinsights/detail.php?ID=120 https://ygraph.com/chart/665

USGS Earthquake Map. Earthquake hazards exists throughout the United States. USGS earthquake map forecasts the moderate to high long-term hazard, even though they have not experienced recent large quakes. Source: http://pubs.usgs.gov/fs/2003/fs017-03/ https://ygraph.com/chart/663

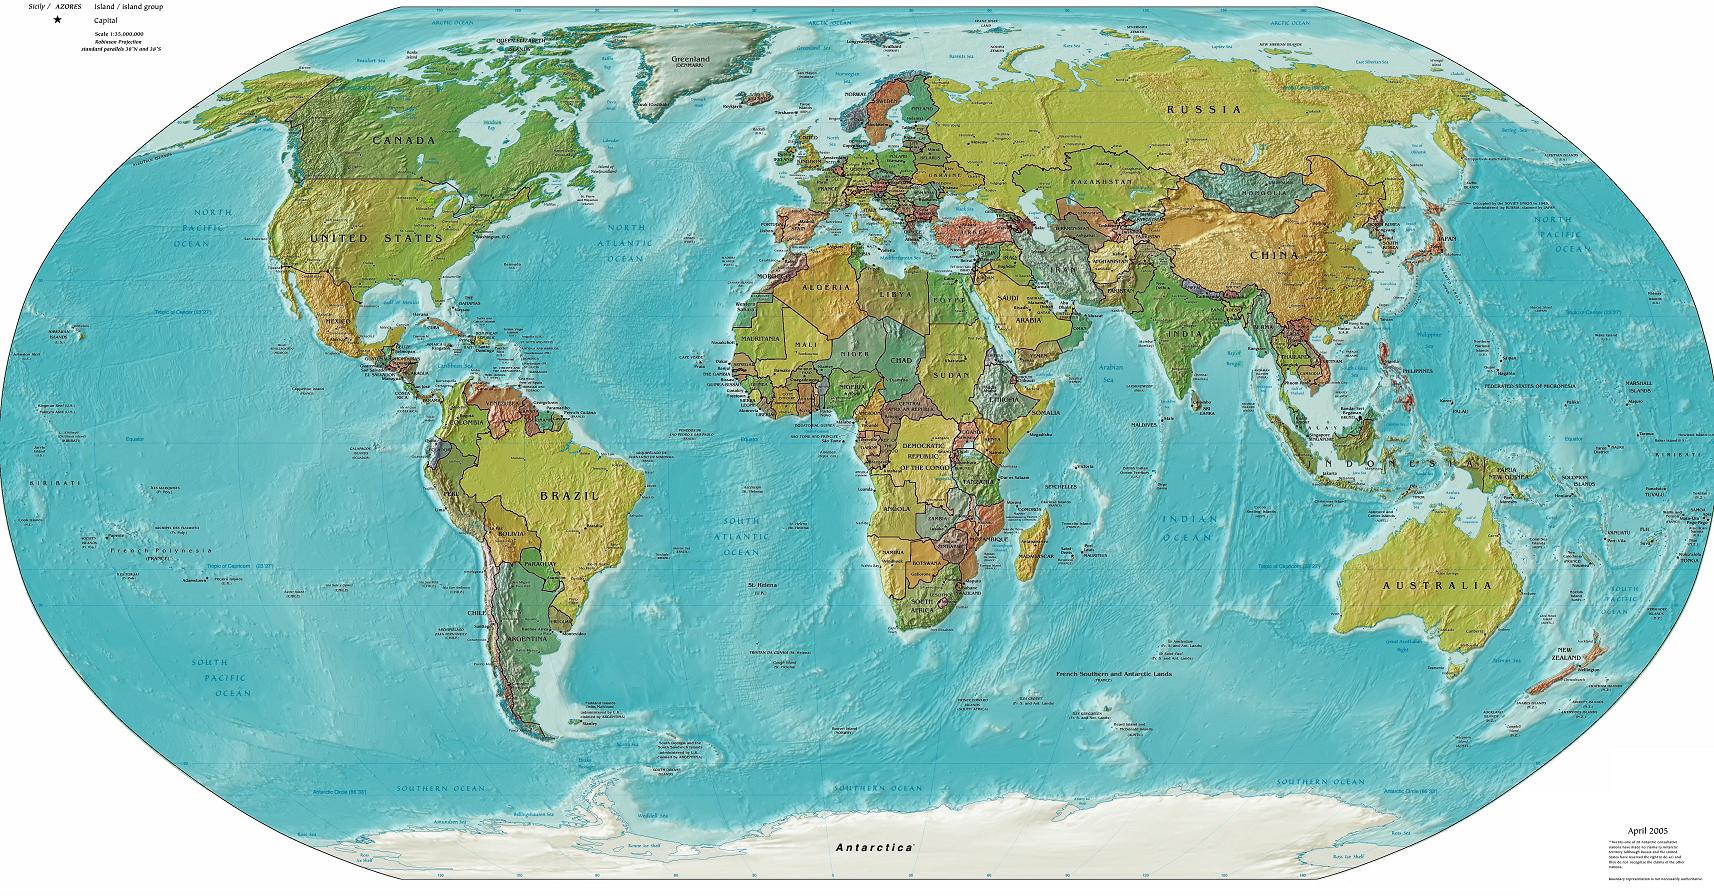
Map Of Earth. Printable. Earth map with countries, cities, including capital cities, geography, oceans, seas and mountains. Large map. Source: http://www.tsiosophy.com/ https://ygraph.com/chart/661

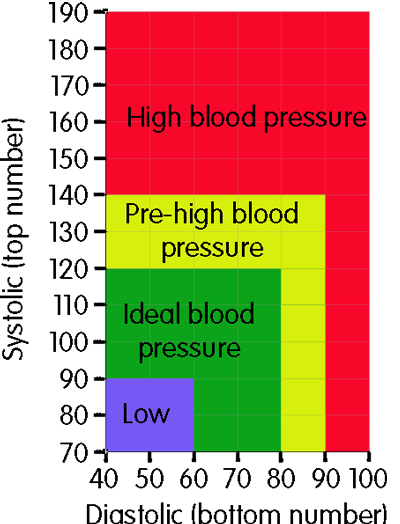
Blood Pressure Chart. Best blood pressure graph for adults. The blood pressure chart below shows ranges of high, low and healthy blood pressure readings. Source: http://www.bpassoc.org.uk/BloodPressureandyou/Thebasics/Bloodpressurechart https://ygraph.com/chart/658

Blood Pressure Chart. Systolic vs. Distolic Blood Pressure Range Chart. Systolic pressure is generated when the heart contracts. Diastolic blood pressure is generated when the heart is relaxed.
Source: http://www.vaughns-1-pagers.com/medicine/blood-pressure.htm https://ygraph.com/chart/656

Blood Pressure Graph. Systolic blood pressure reading by age. Blood pressure (minimum, maximum, average) increases with age. Systolic pressure (the higher reading) is a measure of how hard the heart can pump. Source: http://www.sturnidae.com/BPChart.php https://ygraph.com/chart/655

Blood Pressure Graph. Diastolic Blood Pressure by Age. Blood pressure (minimum, maximum, average) increases with age. Blood Pressure Chart. Source: http://www.sturnidae.com/BPChart.php https://ygraph.com/chart/653

Offshore Company Structure. Offshore IBCs and Trust ownership chart and structure. Source: http://stonecorporation.org/OffShoreStructures.html https://ygraph.com/chart/651
