Contribution to Global Carbon Monoxide Emissions 2000 by country https://ygraph.com/chart/427
Contribution to Global Carbon Monoxide E

Charts, Graphs and Diagrams
Contribution to Global Carbon Monoxide Emissions 2000 by country https://ygraph.com/chart/427

Stock market: the Broker / Dealer Index which reflects the action within the financial sector. Source: http://www.sunshineprofits.com/commentary/15-mar-0 https://ygraph.com/chart/424

Oil price chart 2002 – 2011, monthly: Source http://www.fxtimes.com/fundamental-updates/oil-falls-to-85-a-barrel-as-kuwaiti-official-hints-at-opec-raising-production/ https://ygraph.com/chart/423

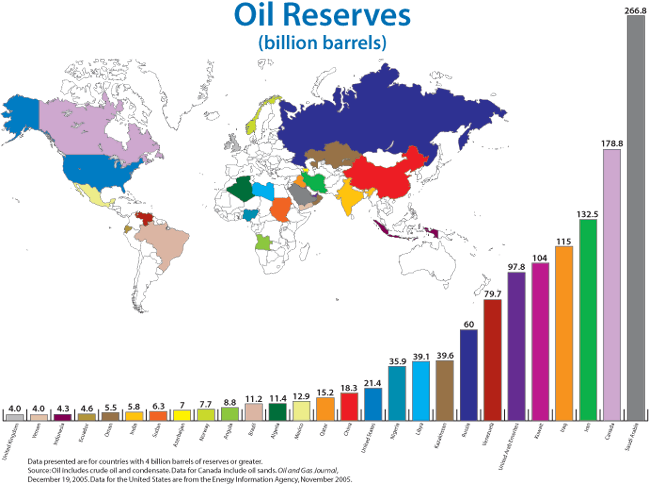
World OIl Reserves by Country. Who has the oil? Source: http://presscore.ca/nbg/index.php?entry=entry080522-071515 https://ygraph.com/chart/422

Peak Oil: Oil producing countries past peak. Source: http://gasprices-usa.com/ https://ygraph.com/chart/421

USA Economy Growith 2004-2008 https://ygraph.com/chart/420
USA Economy Real Household Wealth in Equities and Homes 1952-2009. Source: http://www.marketoracle.co.uk/Article4428.html https://ygraph.com/chart/419

Standard and Poor 500 Index from 1871 to 2008 shows why it pays to stay invested despite wars, depression and political crises. Stock market always grows in the long run. Source: http://moneymorning.com/2008/08/07/stock-market-chart/ https://ygraph.com/chart/418

Gallup’s USA Economic Confidence Index and 2010-2011 by week. Source: http://www.gallup.com/poll/122840/Gallup-Daily-Economic-Indexes.aspx https://ygraph.com/chart/417

Gold adjusted to inflation 1880-2010. Source: http://thedraconian.com/2011/01/06/predictions-for-2011-part-one/ https://ygraph.com/chart/416
