Fertility Rate – Population Growth Rate – Fertility Rate Chart in different countries – Country Fertility Rates Chart. Graph showing children per woman rate over the years 1960 – 2009 in USA, China, India, Germany, Russia population rates. Source: Google https://ygraph.com/chart/1447
Fertility Rate – Population Growth Rate
Fertility Rate – Population Growth Rate – World Fertility Rate Chart – Global Fertility Rates – Fertility Chart. Graph showing children per woman rate over the years 1960 – 2009. The fertility rate is rapidly declining worldwide. Source: Google https://ygraph.com/chart/1446
Fertility Rate – Population Growth Rate
How To Tie a Tie – Tying a Tie – how to
How To Tie a Tie – Tying a Tie – how to tie a tie graphic – Tie chart – Different Ties Charts. Tying different types of ties with images of the tie knot. Source: VisualInformation how to tie a tie
How To Tie a Tie – Tying a Tie – how to
How To Tie a Tie – Tying a Tie – how to tie a tie graphic – Tie chart – Different Ties Charts. Tying different types of ties: Four in Hand, Half Windsor, Windsor, Shell Knot ties. https://ygraph.com/chart/1444
How To Tie a Tie – Tying a Tie – how to
Airplane Chart – Aircraft Comparison Cha
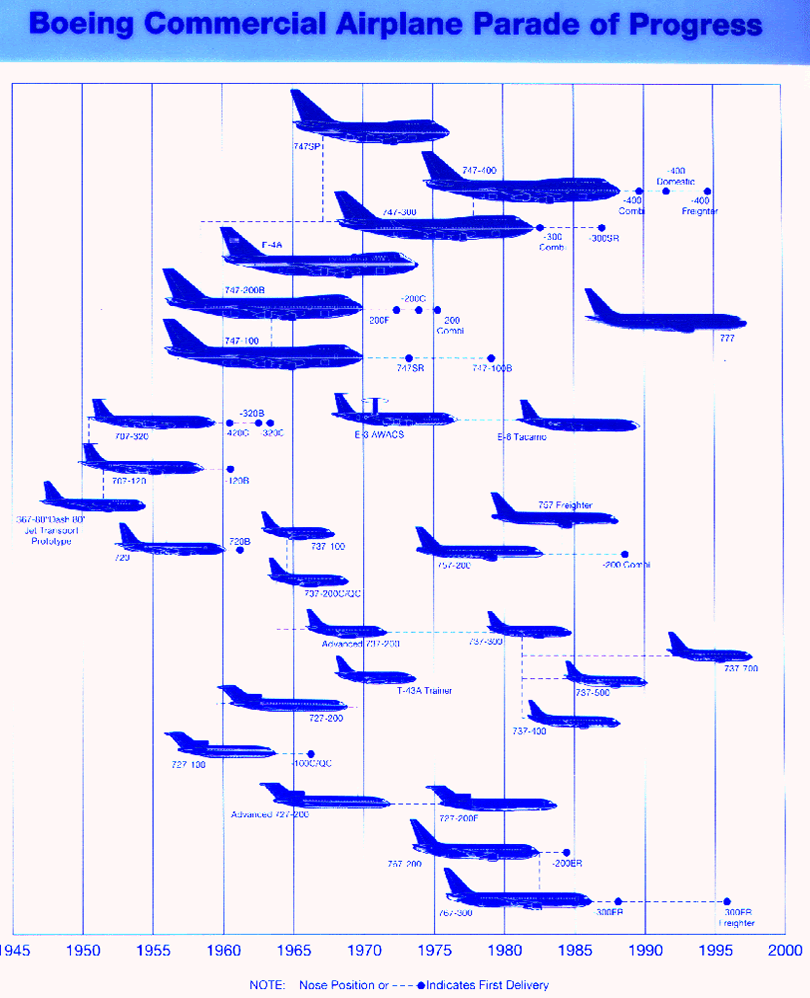
Airplane Chart – Aircraft Comparison Chart – Compare Plane Sizes – Size of Airplanes Chart. Chart showing Boeing aircraft from 707 to 777. Boeing commercial airplane chart progress by year. Aircraft history chart. Source: Aviationexplorer airplane chart
Airplane Chart – Aircraft Comparison Cha
A320 Seating Chart – a320 seating chart
A320 Seating Chart – a320 seating chart – Airlines airbus a320 seating plan – A320-200 seating. A320 seating with Northwest airlines, AirCanada, United, American airlines. Source: Aviationexplorer airbus a320
A320 Seating Chart – a320 seating chart
USA Deficit Graphs – us deficit graph –
USA Deficit Graphs – us deficit graph – us deficit chart. Obama deficits will exceed previous deficits. The chart compares the President’s budget deficit projections to the Congressional Budget Office’s budget deficit projections under law. Source: Midknightgraphs https://ygraph.com/chart/1441
USA Deficit Graphs – us deficit graph –
US Deficit Graph – USA deficit graph – A
US Deficit Graph – USA deficit graph – American Deficit Chart – us deficit chart – us debt graph. Source: Midknightgraphs us deficit graph
US Deficit Graph – USA deficit graph – A
Dow Jones Graph – dow jones graph 5 year
Dow Jones Graph – dow jones graph 5 year chart – Dow Jones Chart – dow jones chart – dow jones charts. 2007-2011. DJI Index price movement. Source: Yahoo Finance https://ygraph.com/chart/1439
Dow Jones Graph – dow jones graph 5 year
Dow Jones Graph – dow jones graph 2011 –
Dow Jones Graph – dow jones graph 2011 – Dow Jones Chart – dow jones chart – dow jones charts. DJI graph. DJI chart. 2011. DJI index chart. Dow jones chart. Volume and trading price. Source: Yahoo Finance dow jones graph