Origami Diagram. Origami chart. Origami dinosaur. How to make an origami for kids. Origamis. Source: JewsWar https://ygraph.com/chart/1556
Origami Diagram. Origami chart. Origami

Charts, Graphs and Diagrams
Origami Diagram. Origami chart. Origami dinosaur. How to make an origami for kids. Origamis. Source: JewsWar https://ygraph.com/chart/1556

Origami – Origami Diagram – Origami Chart – How to make an origami – Origami Examples – Origami Samples. Origami peace crane directions. How to make an origami peace crane. A paper crane is an ancient origami pattern that symbolizes health and peace. Source: PlanetPals https://ygraph.com/chart/1555

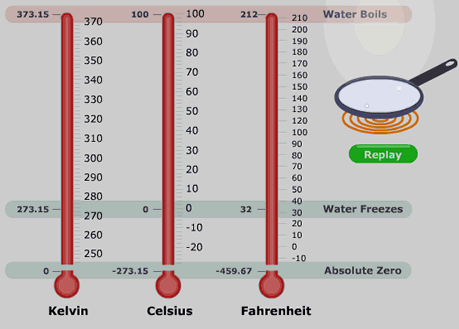
Temperature scales. Degree Fahrenheit, degree Kelvin and degree Celsius are used to measure the temperature. Temperature Chart. Comparison of Temperature Scales. Temperatures of absolute zero, temperatures, at which water freezes, water boils. Source: PennState https://ygraph.com/chart/1554

Celsius to Fahrenheit – Celsius to Fahrenheit Conversion – Fahrenheit to Celsius Chart – Temperature Conversion Chart – Conversion of Temperatures – Metric Temperature Conversion Diagram. Celcius to Fahrenheit Chart. Source: Dimensionsguide https://ygraph.com/chart/1553

GMAT Test – GMAT statistics by age of the application and year. GMAT Tests taken by Testing Year and Age, 10 year trend 2001 – 2010 / 2011. MBA GMAT scores. MBA business school scores chart by age. Graph showing mba applications and gmat tests. Source: Edroads https://ygraph.com/chart/1552

GMAT Scores Chart – Business Schools Scores Chart – GMAT Percentiles chart. GMAT 2011, GMAT Scores – GMAT Diagram – GMAT Points – Average Scores for Business Schools. Business schools GMAT scores chart by percentales. GMAT Scoring scale chart. Source: Testmasters https://ygraph.com/chart/1551

Med School Scores Chart 2011 – Average MCAT scores chart – Average MCAT scores diagram and graph 2007 – 2010. What is a good MCAT score? Good MCAT score is a two digit score on each section, and an N on the writing sample. Source: Test-Prep Online https://ygraph.com/chart/1550

MCAT Scores Chart – Medical School Score Chart – Med School MCAT Test Scores Diagram – MCAT – Med School. Average MCAT score, good MCAT scores, low MCAT. Improve scores with MCAT practice tests. MCAT exam for students applying to med schools. Source: Loraleeehaze https://ygraph.com/chart/1549

80/20 Chart. Pareto Principle Diagram. What is 80/20 Principle? The 80/20 Principle asserts that there is an inbuilt imbalance between inputs and outputs, effort and result. It states that a minority of causes lead to a majority of result. Source: 1000Ventures https://ygraph.com/chart/1548

80 – 20 Rule – 80/20 Rule – 80-20 Principle – Pareto Principle – Pareto Rule. The Pareto principle (80–20 rule, the law of the vital few, and the principle of factor sparsity) states that, for many events, roughly 80% of the effects come from 20% of the causes. https://ygraph.com/chart/1547
