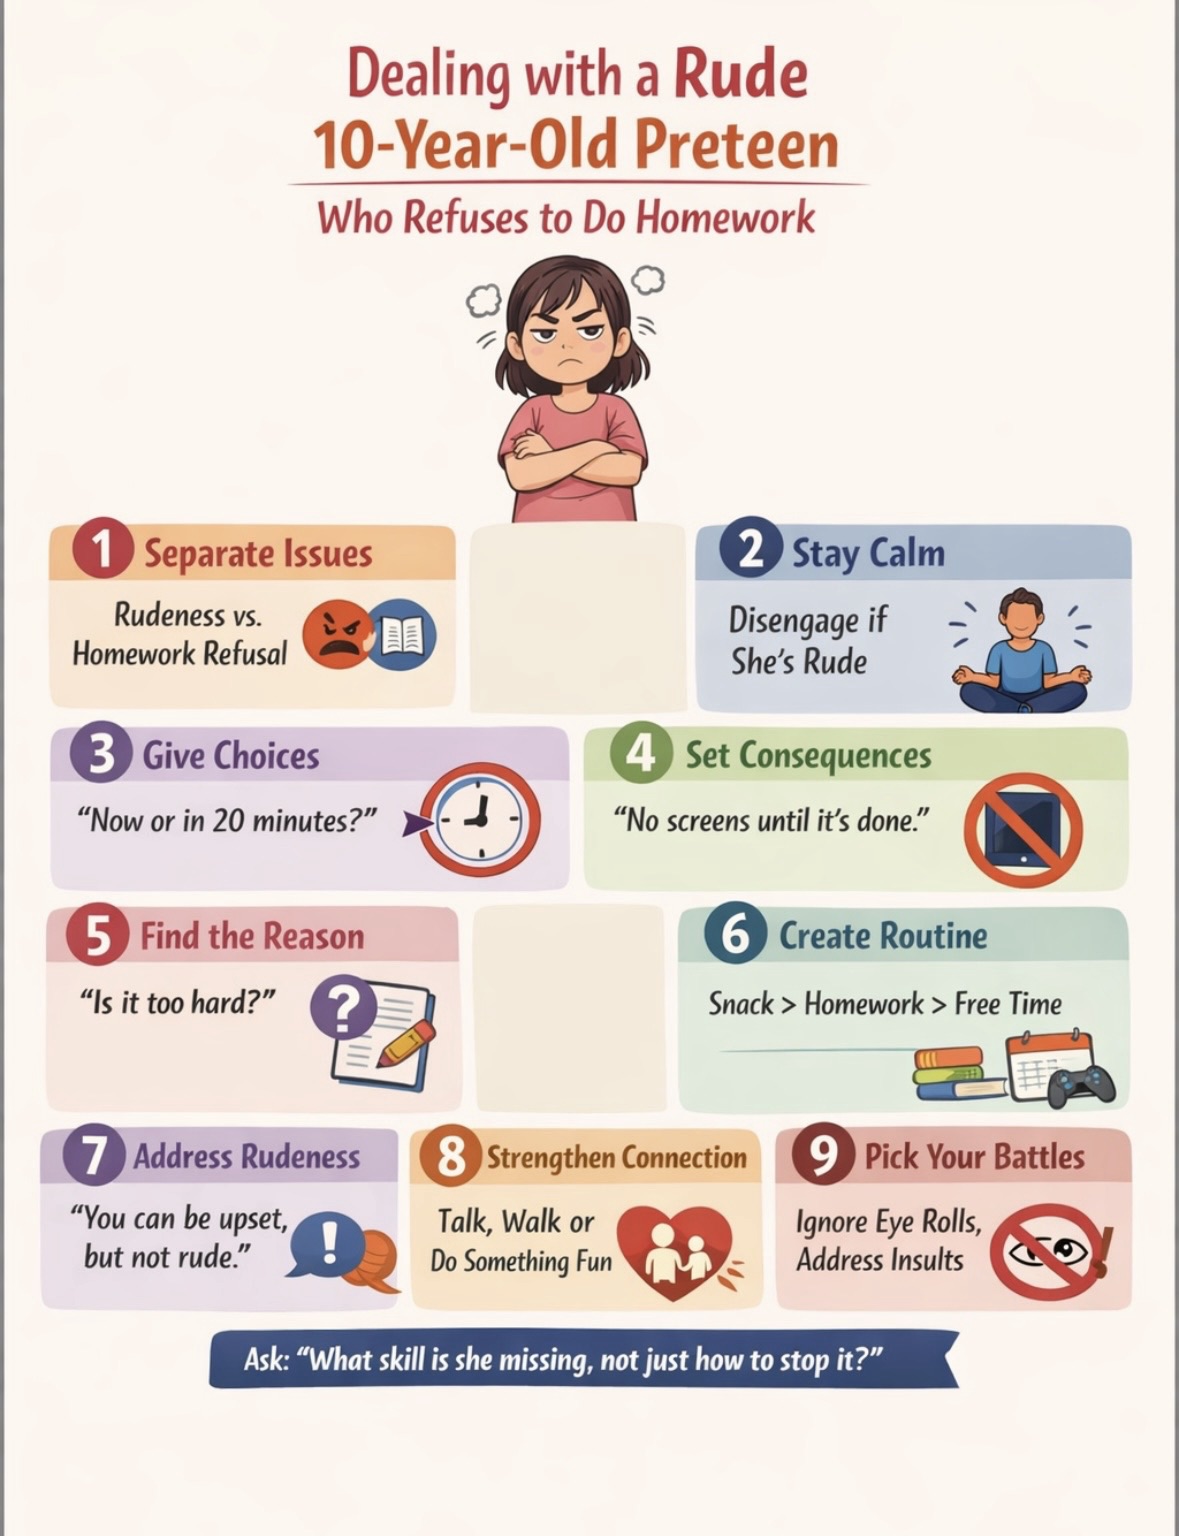
Guam Births per woman

Chart above demonstrates Guam Births per woman. World Bank is the source of this birth data. Based on the latest demographics info provided for Guam.

Guam exhibits moderate fertility rates, higher than mainland U.S. averages, influenced by traditional cultural values and a younger population. The island’s demographics are shaped by a combination of natural growth and the movement of military personnel and their families.

Guam Births per woman

Line Diagram Chemistry

Line structures, also known as skeletal structures or line bond structures, are a simplified way of drawing organic molecules that are commonly used by organic and biological chemists. The convention is quite simple and makes it easier to draw molecules, but line structures do take a little bit of getting used to. Carbon atoms are depicted not by a capital C, but by a ‘corner’ between two bonds, or a free end of a bond. Open-chain molecules are usually drawn out in a ‘zig-zig’ shape. Hydrogens attached to carbons are generally not shown: rather, like lone pairs, they are simply implied (unless a positive formal charge is shown, all carbons are assumed to have a full octet of valence electrons). Hydrogens bonded to nitrogen, oxygen, sulfur, or anything other than carbon are shown, but are usually drawn without showing the bond.

Line structures are used to represent organic molecules in a compact and simplified way. They are particularly useful for larger, more complex biological molecules, where it becomes impractical to use full Lewis structures. Line structures make it much easier to see the basic structure of the molecule and the locations where there is something other than C-C and C-H single bonds.

In order to interpret condensed and line structures, it is important to understand how to draw them. To draw the condensed structure of a given Lewis Structure or line structure, one must first understand the basic structure of the molecule. For example, if you look ahead in a chapter on organic chemistry, you will see that the figures are somewhat different from the Lewis structures you are used to seeing in your general chemistry book. In some sources, you will see condensed structures for smaller molecules instead of full Lewis structures. To draw the line structure of a given Lewis Structure or condensed structure, one must understand the convention of line structures. Carbon atoms are depicted not by a capital C, but by a ‘corner’ between two bonds, or a free end of a bond. Open-chain molecules are usually drawn out in a ‘zig-zig’ shape. Hydrogens attached to carbons are generally not shown: rather, like lone pairs, they are simply implied (unless a positive formal charge is shown, all carbons are assumed to have a full octet of

Line Diagram Chemistry

Mauritania Population

Chart above demonstrates Mauritania Population. The country statistics are compiled by World Bank. Latest population information for Mauritania.

Mauritania has a young and rapidly growing population, supported by high fertility rates and improving healthcare. Urbanization is increasing, although the majority of the population still lives in rural areas. Economic challenges and environmental factors, such as desertification, shape demographic patterns, while government efforts focus on managing growth sustainably.

Mauritania Population

World Population Growth

World population growth is the change in the number of people living on Earth over time. It is influenced by factors such as birth rates, death rates, migration, and environmental changes. Here is a brief overview of world population growth in about 1000 words:

The world population has increased rapidly in recent centuries, reaching 8.1 billion people in 2024. However, the growth rate has slowed down from its peak of around 2% per year in the late 1960s to around 0.9% per year in 2024. This slowdown is mainly due to the decline in fertility rates, which is the average number of children per woman, across most regions of the world. Fertility rates have fallen from about 5 children per woman in 1950 to about 2.4 children per woman in 2020. This decline is influenced by various factors, such as education, health, contraception, urbanization, and women’s empowerment.

The current population increase is estimated at around 73 million people per year. This means that every day, there are about 200,000 more people on the planet than the day before. The majority of this population growth occurs in low- and middle-income countries, especially in Africa and Asia, where fertility rates are still relatively high and mortality rates are declining due to improvements in health and sanitation. In contrast, high-income countries have low or negative population growth, as fertility rates are below the replacement level of 2.1 children per woman and migration is not enough to offset the aging and shrinking of the population.

The future of world population growth is uncertain, as it depends on the trends and projections of fertility, mortality, and migration, which are influenced by various social, economic, and environmental factors. The latest UN projections suggest that the world population could grow to around 8.5 billion in 2030 and 9.7 billion in 2050, before reaching a peak of around 10.4 billion people during the 2080s. The population is expected to remain at that level until 2100[^

World Population Growth

Arab World Population

The above graph shows Arab World Population. World Bank is the source of this population data. Based on the latest demographics info provided for Arab World.

The Arab World as a region has experienced significant population growth, fueled by high fertility rates and a youthful demographic structure. While some countries like Lebanon and Tunisia are seeing declines in births per woman, others such as Yemen and Iraq still have high fertility. Urbanization and economic development are beginning to reshape these dynamics.

Arab World Population

Turkiye Births per woman

This diagram presents Turkiye Births per woman. World Bank is the source of this birth data. Latest births per woman information for Turkiye.

Turkey’s fertility rate has declined significantly in recent decades due to urbanization, education, and economic development. While still above many European countries, birth rates are near replacement level. Population growth is moderate, with internal migration influencing urban demographics. Family policies aim to balance demographic trends with economic needs.

Turkiye Births per woman

Belize Population

This diagram presents Belize Population. This is according to World Bank total population stats. Based on the latest demographics info provided for Belize.

Belize’s population is small but growing at a moderate pace. Urbanization, youth migration, and a relatively high birth rate shape the country’s demographic profile, with a young population structure and increasing access to healthcare and education.

Belize Population

Economics Diagrameconomic Flow Diagram

The term economic flow refers to the movement of goods, services, and money within an economy. It is a fundamental concept in economics that helps us understand how different sectors of the economy interact with each other. There are two main models that economists use to explain economic flow: the circular flow model and the economic cycle.

The circular flow model is a simplified representation of how money and goods move between households and businesses. In this model, households provide labor to businesses in exchange for wages, which they use to purchase goods and services from businesses. Businesses, in turn, use the revenue generated from these sales to pay for labor and other inputs. This creates a circular flow of money and goods between households and businesses, which is essential for the functioning of a market economy .

The economic cycle, also known as the business cycle, refers to the fluctuations in economic activity that occur over time. The cycle is characterized by four stages: expansion, peak, contraction, and trough. During the expansion phase, the economy grows rapidly, with low unemployment rates and high levels of consumer spending. The peak phase marks the end of the expansion and the beginning of a contraction, during which economic activity slows down, unemployment rates rise, and consumer spending decreases. The trough phase is the bottom of the cycle, where the economy is at its weakest. Finally, the cycle enters the expansion phase again, and the process repeats itself .

The economic cycle is driven by a variety of factors, including changes in interest rates, government policies, and technological innovations. Understanding the economic cycle is important for investors and businesses, as it can help them make informed decisions about when to invest and when to pull back. It is also important for policymakers, who can use fiscal and monetary policies to stabilize the economy during times of contraction .

In conclusion, the concept of economic flow is essential for understanding how different sectors of the economy interact with each other. The circular flow model and the economic cycle are two important models that economists use to explain economic flow. By understanding these models, we can gain a better understanding of how the economy works and make informed decisions about our investments and policies.

Economics Diagrameconomic Flow Diagram