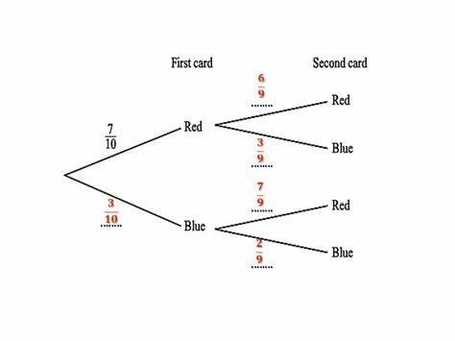
A probability tree diagram is a visual tool that helps to calculate probabilities of dependent and independent events. It is a tree-like structure that starts with a single event and branches out to show all possible outcomes of the event. Each branch represents a possible outcome of the event, and the probability of each outcome is written on the branch. The probability of each outcome is calculated by multiplying the probabilities of the corresponding branches. The sum of the probabilities of all possible outcomes should always equal one.
For example, let’s say you want to calculate the probability of flipping a coin twice and getting heads both times. You can use a probability tree diagram to visualize all possible outcomes of the event. The first branch of the tree represents the first flip, and the second branch represents the second flip. Each branch has two possible outcomes: heads or tails. The probability of getting heads on the first flip is 0.5, and the probability of getting heads on the second flip is also 0.5. To calculate the probability of getting heads both times, you multiply the probabilities of the corresponding branches: 0.5 x 0.5 = 0.25. Therefore, the probability of flipping a coin twice and getting heads both times is 0.25.
Probability tree diagrams can be used to calculate the probability of any event that has multiple outcomes. They are especially useful for calculating the probability of dependent events, where the outcome of one event affects the outcome of another event. For example, let’s say you want to calculate the probability of drawing two cards from a deck of cards and getting two aces. The probability of drawing an ace on the first draw is 4/52, since there are four aces in a deck of 52 cards. However, the probability of drawing an ace on the second draw depends on the outcome of the first draw. If you draw an ace on the first draw, there are only three aces left in the deck, so the probability of drawing an ace on the second draw is 3/51. If you don’t draw an ace on the first draw, there are still four aces left in the deck, so the probability of drawing an ace on the second draw is 4/51. You can use a probability tree diagram to visualize all possible outcomes of the event and calculate the probability of getting two aces.
