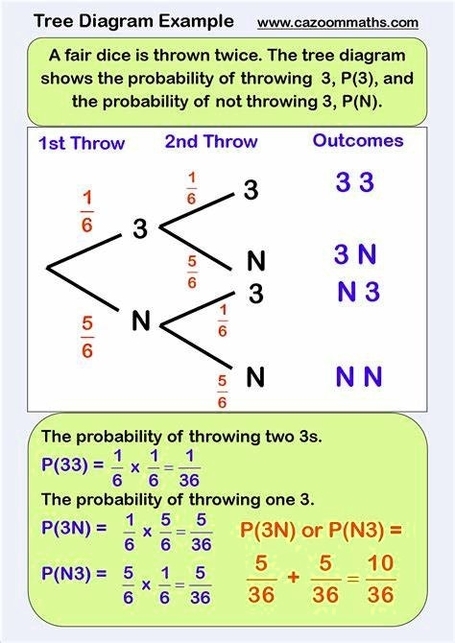
Probability trees are visual tools that help us calculate probabilities for different scenarios involving one or more events. They show the possible outcomes of each event and the probabilities of each branch. To find the probability of a particular outcome, we multiply the probabilities along the branches and add the probabilities down the columns. Here is an example of a probability tree for tossing a coin twice:
“`latex
begin{tikzpicture}[grow=right, sloped]
node[bag] {}
child {
node[bag] {T}
child {
node[end, label=right:
{T,T $0.5 times 0.5 = 0.25$}] {}
edge from parent
node[above] {$0.5$}
}
child {
node[end, label=right:
{T,H $0.5 times 0.5 = 0.25$}] {}
edge from parent
node[above] {$0.5$}
}
edge from parent
node[above] {$0.5$}
}
child {
node[bag] {H}
child {
node[end, label=right:
{H,T $0.5 times 0.5 = 0.25$}] {}
edge from parent
node[above] {$0.5$}
}
child {
node[end, label=right:
{H,H $0.5 times 0.5 = 0.25$}] {}
edge from parent
node[above] {$0.5$}
}
edge from parent
node[above] {$0.5$}
};
end{tikzpicture}
“`
The first set of branches shows the possible outcomes of the first toss: heads (H) or tails (T), each with a probability of 0.5. The second set of branches shows the possible outcomes of the second toss, given the first toss. For example, if the first toss is heads, then the second toss can be either heads or tails, each with a probability of 0.5. The end points of the tree show the four possible outcomes of tossing a coin twice: HH, HT, TH, TT. Each outcome has a probability of 0.5 x 0.5 = 0.25, since we multiply the probabilities along the branches. To find the probability of a certain event, we add the probabilities of the outcomes that satisfy the event. For example, the probability of getting at least one head is 0.25 +