Skip to content
cropped logo

Ygraph

Charts, Graphs and Diagrams

Menu

Primary menu

  • Submit Diagram
  • Science
  • Business
  • Economy
    • GDP
  • Demographics
  • Explained
    • Signs
    • Maps
  • Health
  • Anatomy
  • Sizes

Learning Science

Learning Science

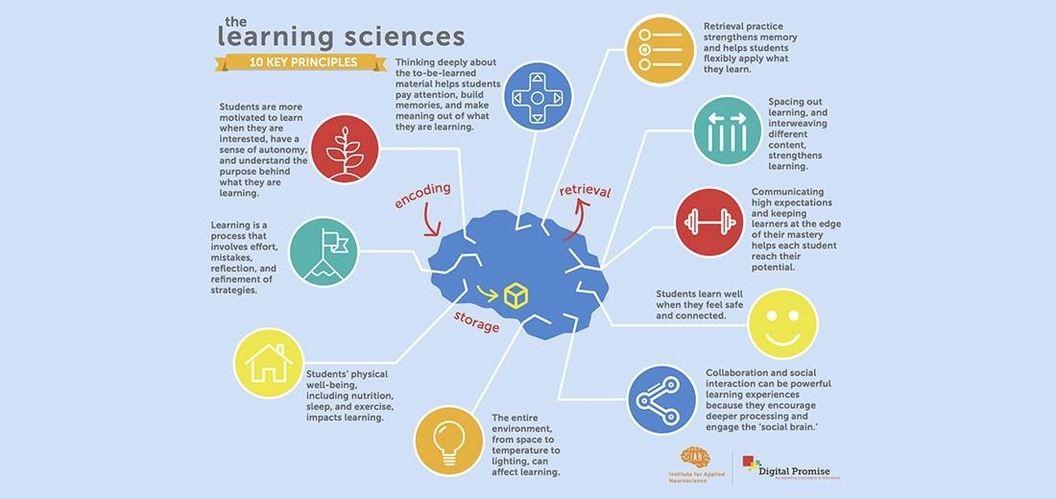
Learning Science: Learning science involves understanding how people learn and applying this knowledge to improve educational practices. It combines insights from psychology, neuroscience, and education to develop effective teaching methods and learning environments.

cognitive science in education, educational psychology, how we learn infographic, learning process visual, science of learning diagram

Post navigation

← Previous Previous post: Libya Population
Next → Next post: Albania Births per woman

Primary Sidebar Widget Area

Top Diagrams

Latest Posts

  • World Population By Ethnicity Pie Chart
  • Greenhouse Gas Emissions From Farming
  • Middle East & North Africa Births per woman
  • Sri Lanka Births per woman
  • Euro area Births per woman
  • Basic Body Diagram
  • Nicaragua Births per woman
  • Lithuania Population
  • Life Sciences Caps Diagrams Grade 12
  • Diagram Science
  • Real Number Set Diagram
  • Women’s Shoe Size Conversion Chart
  • Us Share Of Global Economy
  • Micronesia Births per woman
  • Political Spectrum 58

Top Tags

  • sizes (35)
  • size chart (35)
  • size conversion (35)
  • economy chart (33)
  • economy graph (33)
  • economy diagram (33)
  • cell (29)
  • cell diagram (29)
  • cell illustration (29)
  • window (24)
  • window diagram (24)
  • types of windows (24)
  • origami (16)
  • origami steps (16)
  • how to make origami (16)
  • biology (16)
  • biology diagram (16)
  • yoga (8)
  • yoga routine (8)
  • yoga poses (8)

Categories

  • anatomy
  • Business
  • chart
  • Demographics
  • Eco
  • Ecom
  • Economy
  • Explained
  • GDP
  • Health
  • Maps
  • notice
  • science
  • Signs
  • Sizes
  • Uncategorized

Useful Resources

  • Chart Diagram
  • Meme Gif
  • Logo Sign
  • Human Anatomy
  • Graph Diagram
  • Economy GDP
  • Twitter
Copyright © 2026 Ygraph. All Rights Reserved.
Theme: Catch Box by Catch Themes
Scroll Up
WP Twitter Auto Publish Powered By : XYZScripts.com