Diamond Shape Chart. Diamond shapes include: round, princess, marquise, pear, emerald, radiant, asscher, cushion. Source: http://www.eternaldiamond.com/home/about-criteria/ https://ygraph.com/chart/611
Diamond Shape Chart. Diamond shapes inc

Charts, Graphs and Diagrams
Diamond Shape Chart. Diamond shapes include: round, princess, marquise, pear, emerald, radiant, asscher, cushion. Source: http://www.eternaldiamond.com/home/about-criteria/ https://ygraph.com/chart/611

Diamond Price Chart. Diamond Prices Depending on the Carat Weight Bracket. Graph shows how fast the price per carat jumps with diamond weight. Source: http://www.diamondpriceguru.com/shopping-guide/2008/03/02/carat/ https://ygraph.com/chart/612

TSH Levels Chart: Low Normal Thyroid Levels Cause Weight Gain and are associated with an inability to lose weight and obesity. S-TSH and Body Mass Index (BMI). S-free T4 and BMI. Source: http://www.hormoneandlongevitycenter.com/thyroidtreatments1/ https://ygraph.com/chart/553

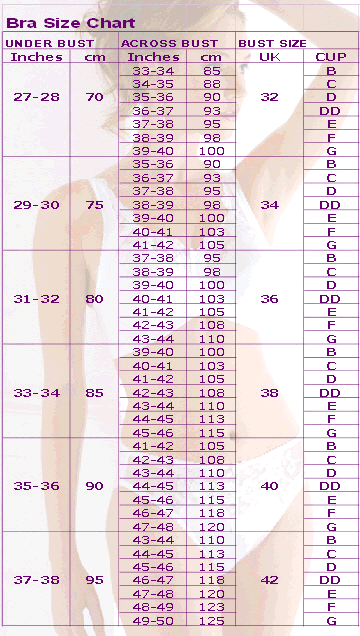
Bra Sizes Chart. How to determine your bra and cups size. Bra size measurement women. Bra and cup size. While wearing a bra, take the following measurements: Step 1: Measure under and add 5 inches to determine bra size, step 2: use chart to determine cup size. bra sizes chart

Bra Sizes Chart. Calculate your bra size by measuring across bust and under bust. Source: http://www.suzannecharles.co.uk/acatalog/Size_Charts.html https://ygraph.com/chart/558

Kids Weight Chart – Healthy weights for children, ages 1-18, for boys and girls. Source: http://www.fruitandveggieguru.com/ExtraSections/ProduceandKids/ChildhoodObesity/tabid/77/Default.aspx https://ygraph.com/chart/570

Kids Weight Chart: Weight in pounds and Height in inches for both girls and boys, aged Birth – 18 years old. Source: http://www.doh.state.fl.us/family/childhealth/childreport/goals/goal1/weight_chart.jpg https://ygraph.com/chart/572

Baby Development Chart. Baby Growth Chart. Baby Development diagram. Child development chart. Children development chart. Baby Growth Diagram. Source: Faslink baby development chart
