United Kingdom GDP PPP

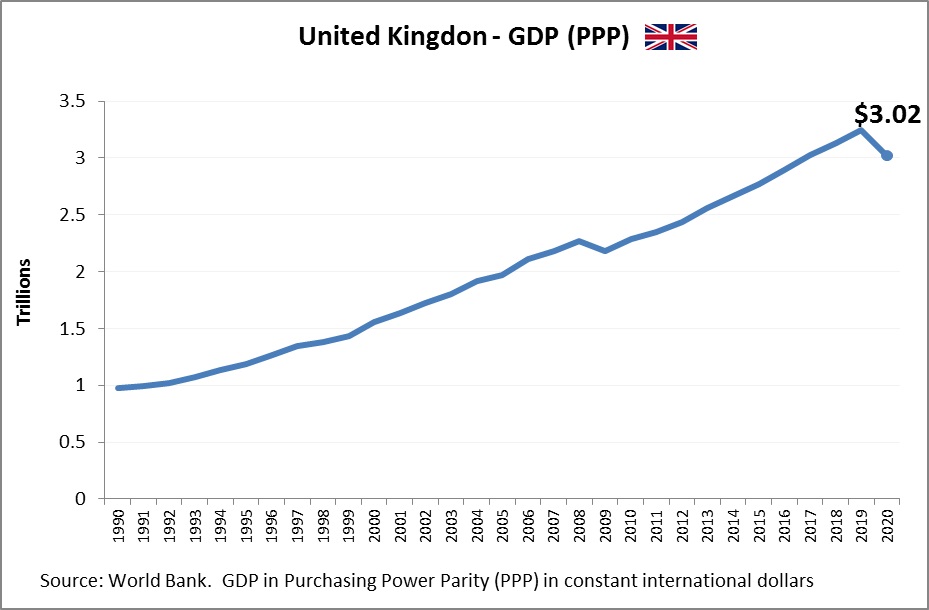
United Kingdom economy size measured in Power Purchasing Parity, i.e. comparing relative standard of living and ability to afford goods and services. United Kingdom’s Gross Domestic Product (GDP) chart showing historical economic growth as measured in PPP international dollars.

United Kingdom: The United Kingdom’s GDP PPP remains high, positioning it among the top global economies. With strengths in finance, technology, pharmaceuticals, and creative industries, the UK maintains a significant total output despite its smaller population compared to some economic rivals. Its per capita GDP PPP is also very high, indicating a wealthy, developed nation with high consumer purchasing power. Post-Brexit adjustments have introduced new challenges, but the country continues to benefit from strong institutions, a global business presence, and a highly skilled workforce.

United Kingdom GDP PPP

Brazil GDP PPP

Brazil economy size measured in Power Purchasing Parity, i.e. comparing relative standard of living and ability to afford goods and services. Brazil’s Gross Domestic Product (GDP) chart showing historical economic growth as measured in PPP international dollars.

Brazil: Brazil’s GDP PPP reflects the scale and diversity of Latin America’s largest economy, bolstered by a broad mix of agriculture, mining, energy, and manufacturing. On a global scale, Brazil has a high overall GDP PPP, ranking in the top ten, primarily due to its large population and abundant natural resources. However, the per capita GDP PPP tells a more modest story, highlighting persistent issues with income inequality, social disparity, and uneven regional development. Despite these challenges, Brazil remains a key emerging market, with significant potential tied to infrastructure development and demographic advantages.

Brazil GDP PPP

EU GDP PPP

European Union (EU) economy size measured in Power Purchasing Parity, i.e. comparing relative standard of living and ability to afford goods and services among countries. EU’s Gross Domestic Product (GDP) chart showing historical economic growth as measured in PPP international dollars.

EU: The European Union, when considered as a single economic entity, has one of the highest GDP PPP figures globally, thanks to the combined output of 27 member states. This collective economic power reflects a highly developed region with robust industrial bases, strong financial sectors, and significant technological innovation. Per capita GDP PPP across the EU varies widely, from wealthy nations like Luxembourg and Germany to lower-income members such as Bulgaria and Romania. On average, the EU maintains a high per capita GDP PPP, representing one of the world’s most prosperous regions, though internal disparities remain a critical policy concern.

EU GDP PPP

Russia GDP PPP

Russia economy size measured in Power Purchasing Parity, i.e. comparing relative standard of living and ability to afford goods and services. Russia’s Gross Domestic Product (GDP) chart showing historical economic growth as measured in PPP international dollars.

Russia: Russia’s GDP PPP ranks within the top ten globally, driven heavily by its vast natural resource base, particularly oil and gas. The PPP metric significantly increases Russia’s economic size compared to nominal figures, showing the lower domestic cost of living and the scale of internal consumption. However, per capita GDP PPP, while higher than many developing countries, is modest compared to Western economies, highlighting the limitations of a resource-dependent model and challenges with diversification. Geopolitical tensions and sanctions also affect economic performance, though domestic spending power remains relatively stable in PPP terms.

Russia GDP PPP

India GDP PPP

India economy size measured in Power Purchasing Parity, i.e. comparing relative standard of living and ability to afford goods and services. India’s Gross Domestic Product (GDP) chart showing historical economic growth as measured in PPP international dollars.

India: India ranks among the top economies globally in terms of overall GDP PPP, reflecting its large and rapidly growing population. The PPP adjustment highlights the strength of India’s domestic economy, which is driven by services, agriculture, and a burgeoning technology sector. However, per capita GDP PPP remains relatively low, indicating that while the economy is large, individual income and consumption levels are modest compared to developed countries. Nevertheless, India’s expanding middle class, infrastructure investments, and digital transformation present significant opportunities for future per capita growth.

India GDP PPP

Germany GDP PPP

Germany economy size measured in Power Purchasing Parity, i.e. comparing relative standard of living and ability to afford goods and services. Germany’s Gross Domestic Product (GDP) chart showing historical economic growth as measured in PPP international dollars.

Germany: Germany holds one of the highest GDP PPP totals in the world, representing Europe’s largest economy and a global export powerhouse. Its economic model is built on high-value manufacturing, engineering, and a strong Mittelstand (small and medium-sized enterprises). In terms of GDP PPP per capita, Germany also performs very well, signifying strong productivity and a high quality of life. The German economy benefits from deep integration within the EU and a reputation for efficiency and innovation. However, demographic shifts and energy transitions pose long-term challenges to sustaining its economic momentum.

Germany GDP PPP

China GDP PPP

China economy size measured in Power Purchasing Parity, i.e. comparing relative standard of living and ability to afford goods and services. China’s Gross Domestic Product (GDP) chart showing historical economic growth as measured in PPP international dollars.

China: China leads the world in total GDP PPP, having surpassed the United States in this metric due to its massive population and rapid economic growth over the past few decades. This figure reflects the sheer scale of China’s manufacturing capacity, infrastructure investment, and export dominance. However, GDP PPP per capita remains significantly lower than that of developed countries, illustrating the economic disparity between urban and rural areas and the challenges of raising individual wealth across such a large and diverse population. Still, steady improvements in per capita income continue to lift millions into the middle class.

China GDP PPP

Canada GDP PPP

Canada economy size measured in Power Purchasing Parity, i.e. comparing relative standard of living and ability to afford goods and services. Canada’s Gross Domestic Product (GDP) chart showing historical economic growth as measured in PPP international dollars.

Canada: Canada’s GDP PPP portrays a wealthy, stable economy with a strong emphasis on natural resources, technology, and services. Although its overall GDP PPP is not among the top five globally due to its relatively small population, it remains significant and reflects Canada’s strong position in global trade and investment. Per capita GDP PPP is very high, placing Canada among the top-tier economies in terms of individual wealth and quality of life. This affluence is supported by a well-regulated financial system, a highly educated workforce, and a comprehensive social safety net, contributing to a high standard of living.

Canada GDP PPP

Countries by GDP 2020 – List of countrie

Countries by GDP 2020 – List of countries by their Gross Domestic Product. World economies by size in Nominal terms in US Dollars. The below chart shows top economies in 2020. US is still a number one economy closely followed by China. The same trends are set to continue in 2021. countries by gdp

Countries by GDP 2020 – List of countrie