What can you learn from RG3’s knee injury? Source: http://www.insurancequotes.com/robert_griffin_knee_injury/#.UQwPfKU1bFI https://ygraph.com/chart/3011
What can you learn from RG3’s knee injur

Charts, Graphs and Diagrams
What can you learn from RG3’s knee injury? Source: http://www.insurancequotes.com/robert_griffin_knee_injury/#.UQwPfKU1bFI https://ygraph.com/chart/3011

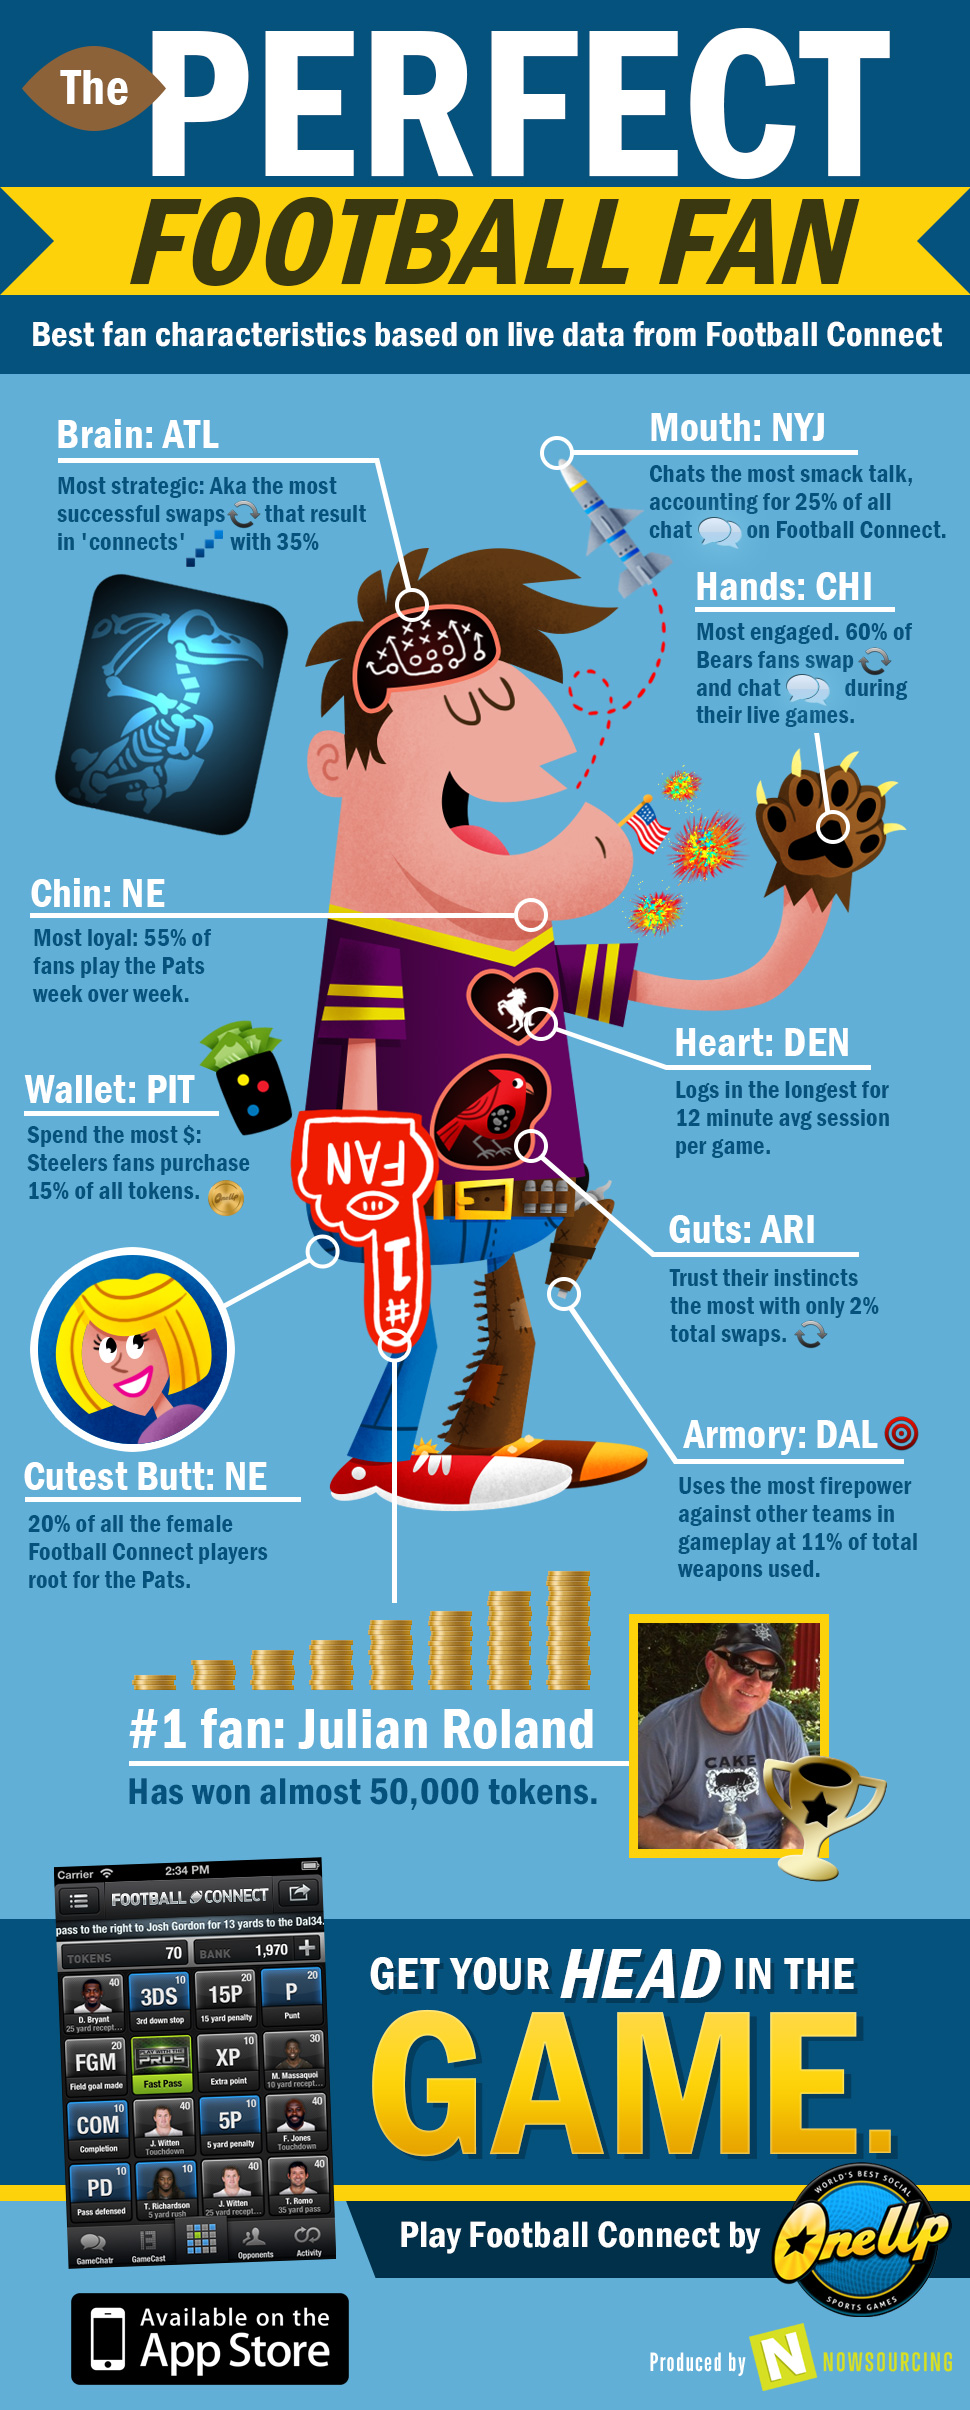
The Perfect Football Fan. Football Fan Diagram. Football Fan Characteristics. American football fan stats. Source: http://1up.me/theperfectfootballfan/ https://ygraph.com/chart/2847

1 in 6 mobile phone customers have experience some degree of bill shock. 50% of those were hit with charges of $50 or more. Want to know how to avoid it? Check out this infographic from Xigo.
http://www.xigo.com/outrageous-roaming/ https://ygraph.com/chart/2861

Number of Websites Chart. Internet Users Chart. Internet Users Graph. Number of Devices Connected to Internet Chart. Internet Security Chart. Number of Internet Breaches . Methods of Attack on the Internet. SQL Injection Chart. Internet Security Diagram. Internet Security Statistics graph. Internet Stats chart. Source: http://www.veracode.com/blog/2012/12/the-state-of-application-security-2012-infographic/ https://ygraph.com/chart/2879

Facebook Privacy Fail Infographic. Facebook Privacy Chart. Privacy Chart. Social Media Privacy Chart. Facebook Statistics Chart. Facebook Privacy Failure Chart. Facebook Timeline chart. Source: http://www.topwebdesignschools.org/facebook-fail/ https://ygraph.com/chart/2881

2012 has really been a great year for social media. Check out all the hottest news this year in this infographic from SEOCO. Social Media 2012. Social Media Chart 2012. Social Media Trends Chart. Social Media Trends: Facebook, Pinterest, Google plus, Kony 2012, Instagram, Time and other news stories. Social Media Stats. Source:
http://www.seoco.co.uk/social-media/ https://ygraph.com/chart/2885

Calendar 2013. 2013 Calendar. Calendar of 2013 showing months, days and weeks. Printable. Source: Chart Diagram calendar 2013

Best Practices to Achieve Maximum Exposure for Your App. Mobile Apps Chart. Mobile Applications Diagram. Average number of Apps on a Smartphone. Smartphone Apps Increase chart. Apps share of Internet Usage. Android App Distribution Chart. Best Practices in Mobile App distribution. How to sell your mobile app? How to create a mobile app? How to make a mobile application? Where can I sell my mobile App? Global Mobile App Market chart. Fastest Growing App Markets Infographic. Source: http://www.startapp.com/android-app-distribution/ https://ygraph.com/chart/2798

First World Problems: There’s Nothing To Drink But Clean, Filtered Water! Water Chart. Clean Water Chart. Water Supply Diagram. World’s Water Supply Chart. World Map showing water problems and statistics. Global Water Supply Statistics. Deaths from lack of access to safe drinking water. Source: http://www.plumber24hours.co.uk/water-information.html https://ygraph.com/chart/2804

Men In Pink Collar. Men Jobs. Men Careers. Men Jobs in Service Industries. What are pink collar jobs? Pink Collar Jobs chart. Pink collar jobs unlike blue collar and white collar jobs include nursing, teaching, social work, administrative assistance, dental hygienist jobs. Men career chart. Men in Women’s Jobs. Job Growth Rate Chart. Men Job growth rate. Job chart. Source: http://workboots.com/pink-collar https://ygraph.com/chart/2806
