Ever wonder what exactly your doctor is

Ever wonder what exactly your doctor is thinking? Doctors are under a serious amount of stress, and it’s a wonder they’re able to hold it together so well.

This infographic from Epocrates gives a little insight into the mind of a doctor. Healthcare Safety Risks. Greatest Challenges for Doctors. Lack of Worklife Balance. Worklife balance chart.

http://www.epocrates.com/e/2012SpecialtySurvey#.UNsKFG9X2NI https://ygraph.com/chart/2892

Ever wonder what exactly your doctor is

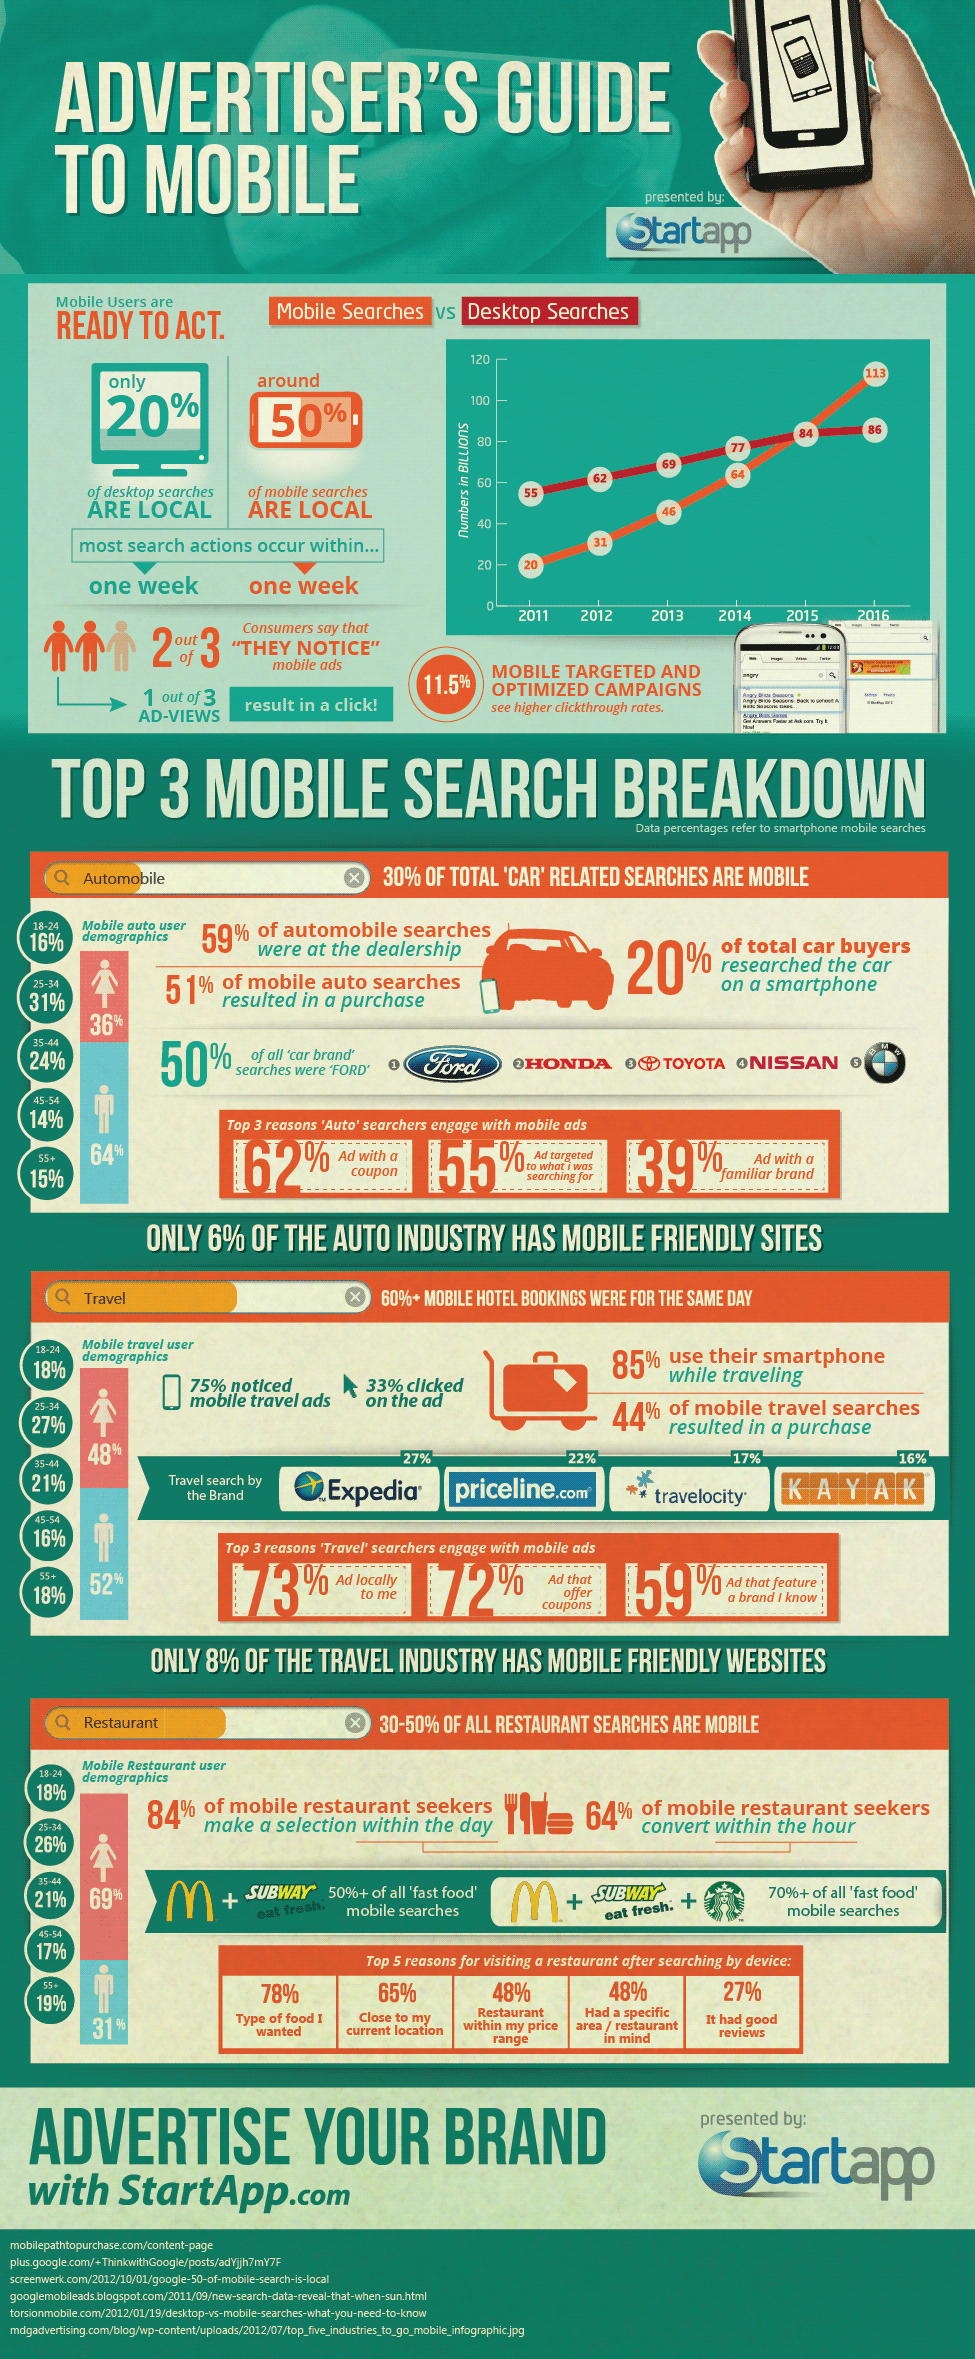
Advertiser’s Guide To Mobile Infographic

Advertiser’s Guide To Mobile Infographic. Internet Search chart. Search Graph. Internet Search Graph. Mobile Searches vs. Desktop Searches Chart. Mobile and Desktop Searches chart. Top Keywords. Search Stats chart. Search diagram. Top Mobile Searches. Top mobile search keywords chart. What do people search for chart. Search Stats infographic. Travel, Auto Industry, Food Industry search chart. Source: http://www.startapp.com/top-mobile-advertisers.html https://ygraph.com/chart/2916

Advertiser’s Guide To Mobile Infographic

CES Trends 2013 Infographic. Best Electr

CES Trends 2013 Infographic. Best Electronics Chart. Best TV. Best Television. Best Car Tech. Best Smart Phone. Best Camera. People’s Voice Award. Top electronics chart. Top TV. Top Television. Top Car Tech. Top smart phones. Top cameras. Source: http://www.bestchoicereviews.org/electronics/ces-trends-2013/ https://ygraph.com/chart/2943

CES Trends 2013 Infographic. Best Electr

What Does the Car of the Future Look Lik

What Does the Car of the Future Look Like? Future car. Future Auto. Future Car Chart. Future Car Stats. Future automobile characteristics including safety, autonomous cars, self-driving cars, efficiency, cars of today, self-driving cars benefits. Future car technology diagram. Infographic. Source: http://www.insurancequotes.com/self-driving-cars/ https://ygraph.com/chart/2923

What Does the Car of the Future Look Lik

The State of Infographics. Infographics

The State of Infographics. Infographics Chart. Infographics Trends. Infographics Statistics Chart. Infographics use graph. Trends in Infographics chart. Major topic trends by Infographics. Animals, business, computers, economy, education, entertainment, environment, food, gaming, geography, health, history, home, how to, love and sex infographics. Infographics statistics chart. Source: http://www.topmarketingschools.net/state-of-infographics/ https://ygraph.com/chart/2925

The State of Infographics. Infographics

Burglary Stats. Burglary Statistics.

Burglary Stats. Burglary Statistics. USA Burglary Stats Chart. Most stolen items chart. Home at risk. Map of Break and Entry in USA. USA burglary map. Cities with most burglary. Burglary rate chart. Security System Chart. Security System Diagram. What do people steal the most? Most stolen items. Source: http://safesoundfamily.com/p/home-burglary-infographic/ https://ygraph.com/chart/2931

Burglary Stats. Burglary Statistics. U

The Impact of Football Season on TV Info

The Impact of Football Season on TV Infographic. Football Stats. Football on TV Statistics. Football Viewers Chart. Football Graph. NFL chart. NFL viewers chart. USA Football chart. American Football views. US Males vs. US Females watching sports. Sports chart. Sport TV chart. Sport viewers infographic. Source: http://www.clicksoftware.com/impact-of-football-season-on-tv-viewers-cable-satellite-industry-infographic.htm#.UPWTPqU1bFJ https://ygraph.com/chart/2945

The Impact of Football Season on TV Info

Internet Usage Chart. Internet use chart

Internet Usage Chart. Internet use chart. Internet Stats Chart. Online stats. Online use statistics chart. Video Chart. Video stats chart. Devices chart. Internet Data chart. Internet stats infographic. Source: http://wikibon.org/blog/wp-content/uploads/2013/01/wikibon-data-footprint.html https://ygraph.com/chart/2938

Internet Usage Chart. Internet use chart