Midlife Crisis and Worst College Degrees. Midlife Crisis Diagram. Career Change Chart. Job Satisfaction Diagram. USA Job Satisfaction chart. Employee engagement chart. Top Careers for burnouts. Top Reasons for Job Dissatisfaction Diagram. Percentage of Job Satisfaction Survey chart. Why switch jobs? Why quit a job? Career change chart. Social sector jobs diagram. Education, health care, nonprofit, government sector career chart. Working from Home diagram. Source: http://graduatedegreeprogram.net/worst-college-degrees/ https://ygraph.com/chart/2735
Category Archives: Explained
Android vs. Apple Social Media Diagram
Android vs. Apple Social Media Diagram. Highest ranked social media sites and apps in app stores. Social media apps download chart. Instagram, Facebook, Google +, Twitter, Pinterest. Number of Android devices vs. Apple devices activated chart. Cellphone app diagram. Social media apps infographic. Social media chart. Android diagram. iPhone Diagram. Source: http://www.startapp.com/who-is-more-social-ios-vs-android-infographic/ https://ygraph.com/chart/2702
Android vs. Apple Social Media Diagram.
What Do You Want To Be When You Grow Up?
What Do You Want To Be When You Grow Up? Jobs chart. Top Jobs chart. Profession Chart. Employment Chart. Diagram showing top jobs, expected income, training required, estimated loans, projected growth. Job Chart. Kids Job Chart. Future Jobs for Children. Top Jobs diagram: Doctor, Athlete, Veterinarian, Musician, Police Officer, Firefighter, Pilot, Actor, Model, Spy. How do I become a doctor, pilot, lawyer, accountant. Top jobs Infographic. Source: http://www.howdoibecomea.net/when-kids-grow-up/ https://ygraph.com/chart/2774
What Do You Want To Be When You Grow Up?
Sports Odds Chart. Greatest Bets in Sports
Sports Odds Chart. Greatest Bets in Sports History. Sports Bets. Sports Betting Diagram. Sports Wager Chart. Basketball Odds Chart. Basketball Winning Odds Diagram. Boxing Championship Wager Diagram. Boxing Bets Chart. Hockey Odds. Hockey Bets chart. Sports Bets chart. World Cup Betting. World Cup Odds Chart. Odds of Winning Chart. Odds of winning diagram. Infographic. Casino Betting Diagram. Source: http://www.casino.org/blog/underdog-sports-bets/ https://ygraph.com/chart/2778
Sports Odds Chart. Greatest Bets in Spo
Is photography dead? Future of Photography Explained
Is photography dead? Photography Chart. Photography Diagram. Photography History Chart. Mobile Photography Chart. Photos Taken Graph. World Photos Graph. How Many Photos are taken each year? Digital Photos vs. Analog Photos Graph. Film history chart. Photography history timeline. Facebook photos chart. Facebook Photography Chart. Instagram Photos chart. Instagram Users Chart. Twitter vs Instagram chart. Mobile Photography. Source: http://overgram.co/mobile-photography.html https://ygraph.com/chart/2792
Is photography dead? Photography Chart.
Price gouging is not as bad as you think
Price gouging is not as bad as you think. Price Gouging. Price Gouging Chart USA. Price Increases due to hurricanes and other natural disasters. Hurricane Sandy Chart. Hurricane Sandy Stats. Hurricane Sandy Statistics. Hurricane Katrina to Hurricane Sandy comparison. Supply and Demand during times of natural disasters. Price Gouging Legal. Government Intervention chart. Government Intervention chart. Anti-price gouging laws. Raising prices chart. Source: http://bestcriminaljustice.com/pricegouging https://ygraph.com/chart/2794
Price gouging is not as bad as you think
Christmas Diagram. Christmas Infographic – Interesting things about christmas
Christmas Diagram. Christmas Chart. Online Retail Sales Chart. Christmas Sales Diagram. Christmas Sales Graph. Christmas Trend Chart. 2012 USA Holiday Sales Projections chart. Christmas Statistics. Christmas Stats. Santa Claus Chart. Average Consumer Spending Chart. Tablet Sales Chart. Cyber Monday Sales Chart. Cyber Monday Diagram Sales. Online Retail Sales chart. Online Retail Diagram. Christmas Gifts Chart. Top gifts received: gift cards, clothing, books, music, videos, video games, electronics, jewellery, computers. Source: http://www.retailcustomerexperience.com/blog/9327/I-Saw-Mommy-Googling-Santa-Claus-Infographic?rb=false https://ygraph.com/chart/2790
Christmas Diagram. Christmas Chart. On
Supply and Demand – Supply Demand Chart
Supply and Demand – Supply Demand Chart – Economic Chart – Demand and Supply Diagram. Price Quantity Diagram. Economic equilibrium chart. PQ diagram. Demand Shift and supply shift due to changes . Source: Economic Perspectives https://ygraph.com/chart/2224
Supply and Demand – Supply Demand Chart
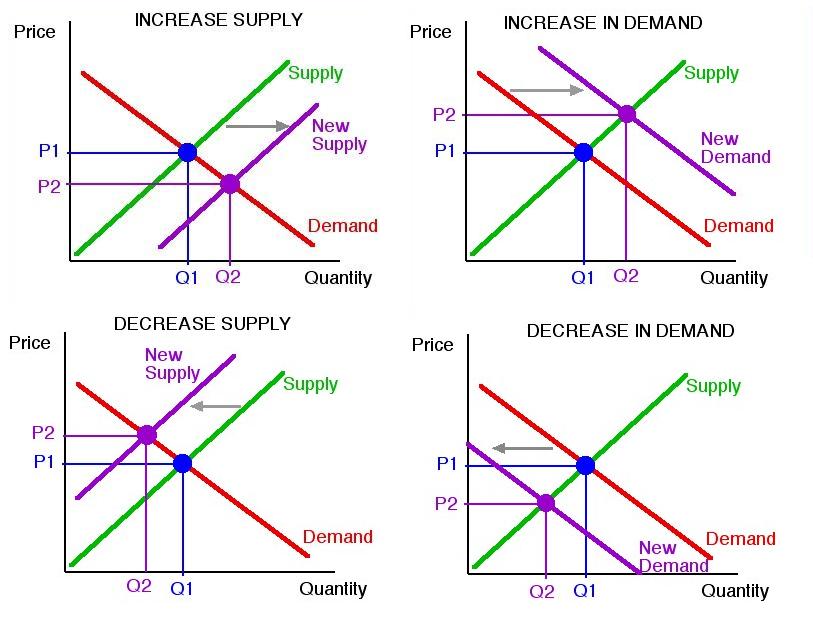
Supply Graph. Demand Graph. Supply vs Demand Graph
Supply Graph. Demand Graph. Increase Demand, Increase Supply, Decrease in Demand, Decrease in Supply. The main demand and supply shifts from market equilibrium. Demand shift, supply shift. Market equilibrium shifts. Price and Quantity Graphs. Source: Ray Bromley https://ygraph.com/chart/2225
Supply Graph. Demand Graph. Increase De
Battery Diagram – Battery Illustration –
Battery Diagram – Battery Illustration – How battery works? Lead Acid Battery. Battery terminal, battery case cover, pressure release valve. Valve diagram. The diagram of a battery cell with labels explained. Source: AutoblogGreen battery diagram