Scrap Iron Prices – Iron Scrap Prices Ch

Scrap Iron Prices – Iron Scrap Prices Chart 5 years up to 2011 – Iron Prices Graph – Scrap Prices Chart – Iron Ore Prices. Scrap Metal Chart. Five year chart (5 year scrap metal chart). 5 year scrap iron prices graph. Source: MetalPrices https://ygraph.com/chart/1420

Scrap Iron Prices – Iron Scrap Prices Ch

Scrap Iron Prices – Iron scrap prices ch

Scrap Iron Prices – Iron scrap prices chart 2001, 1 year iron prices chart – Iron Prices Chart – Scrap Prices Graph – Iron Ore Prices. Scrap Metal Chart. One year chart (1 year scrap metal chart). 1 year scrap iron prices graph. Source: MetalPrices scrap iron prices

Scrap Iron Prices – Iron scrap prices ch

Grain Prices Today – Wheat Prices Today

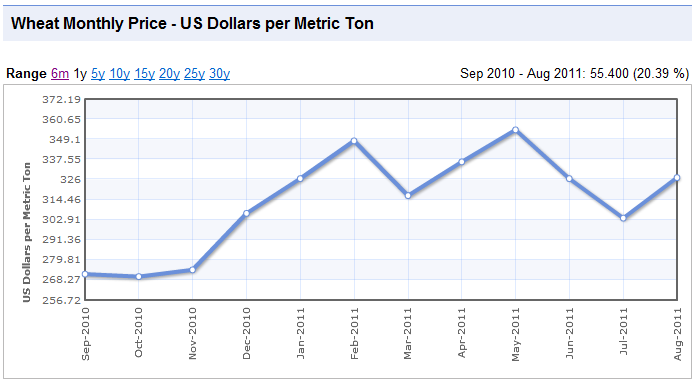
Grain Prices Today – Wheat Prices Today – Wheat Graph – Grain Chart – Wheat Chart – Grain Graph. Wheat Monthly Price – US Dollars per Metric Ton 2010 – 2011. Wheat Daily Price Graph. Source: IndexMundi grain prices chart

Grain Prices Today – Wheat Prices Today

Grain Prices Today – Wheat Prices Today

Grain Prices Today – Wheat Prices Today – Wheat Graph – Grain Chart – Wheat Chart – Grain Graph. Wheat Monthly Price – 10 Year Chart. US Dollars per Metric Ton 2001 – 2011. Wheat Daily Price Graph. Long term graph. Source: IndexMundi wheat prices chart

Grain Prices Today – Wheat Prices Today

US Debt Graph – National Debt Graph – US

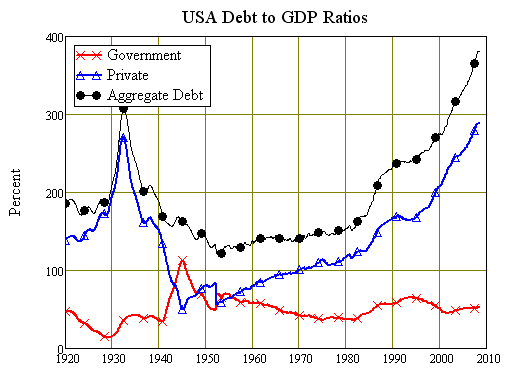
US Debt Graph – National Debt Graph – USA Debt Chart – USA Debt Chart. United States Debt Level. USA debt to GDP ratios. Long term debt graph from 1920 – 2010, 2011. Government debt and private debt levels. Private debt grew much faster that government debt. Source: Debtdeflation US Debt Graph

US Debt Graph – National Debt Graph – US

Countries by GDP List – Largest Economie

Countries by GDP List – Largest Economies by GDP by Purchasing Power Parity (PPP) – Biggest World Economies 2010 Chart. List of countries by GDP. International Monetary Fund, World Bank, CIA World Factbook lists comparison chart. Source: Wikipedia https://ygraph.com/chart/1358

Countries by GDP List – Largest Economie

Top 10 Biggest Economies 2010 and 2020.

Top 10 Biggest Economies 2010 and 2020. GDP Rankings Change. USA Economy. China economy, Japan economy. Economies of India, Germany, Russia, United Kingdom, France, Brazil and Italy. Top GDP countries. How will global economies change in 2020. Source: Euromonitor largest economies by gdp

Top 10 Biggest Economies 2010 and 2020.

Personal Saving Rates in USA. Household

Personal Saving Rates in USA. Household saving rates in 1960 – 2011. Saving last spiked, in the mid-70s, during the worst recession. Current savings rate is the highest its been in a decade. The economy won’t improve until that rate goes down. Source: Huffingtonpost https://ygraph.com/chart/1318

Personal Saving Rates in USA. Household

Saving Rate vs Debt. Household debt as

Saving Rate vs Debt. Household debt as a percentage of GDP and Gross Domestic Savings rates as a percentage of GDP in China and other countries. Compared to most other countries, the US has the lowest personal savings rate in the world. Source: Fidelity https://ygraph.com/chart/1319

Saving Rate vs Debt. Household debt as