USA Housing: Rent or Buy. Median payments for rent and mortgages. 1988-2010. Source: http://thedraconian.com/2011/01/06/predictions-for-2011-part-one/ https://ygraph.com/chart/415
USA Housing: Rent or Buy. Median payment

Your Graphs, Charts and Diagrams
USA Housing: Rent or Buy. Median payments for rent and mortgages. 1988-2010. Source: http://thedraconian.com/2011/01/06/predictions-for-2011-part-one/ https://ygraph.com/chart/415

Gold adjusted to inflation 1880-2010. Source: http://thedraconian.com/2011/01/06/predictions-for-2011-part-one/ https://ygraph.com/chart/416

Gallup’s USA Economic Confidence Index and 2010-2011 by week. Source: http://www.gallup.com/poll/122840/Gallup-Daily-Economic-Indexes.aspx https://ygraph.com/chart/417

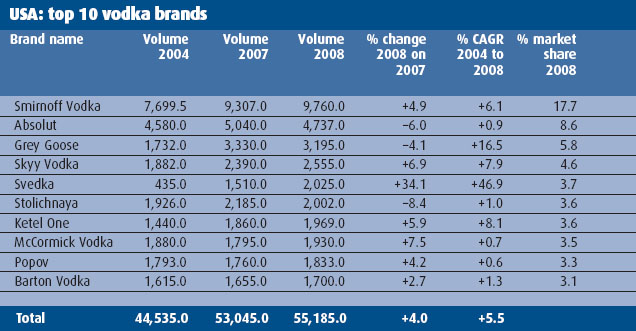
Vodka Chart. USA Top 10 Vodka Charts by brand name. Smirnoff Vodka, Absolut, Grey Goose, Skyy Vodka, Svedka, Stolichnaya by market share. Source: http://inthemix.on-premise.com/2009/09/iwsr-vodka-fights-through-the-turbulence/ https://ygraph.com/chart/677

Vodka Market Share. Consumption of Spirits: Vodka, Gin, Cognac, Rum. Vodka leads the UK spirits market in both sales and growth rate, surpassing Scotch whisky. Source: http://grocerytrader.co.uk/?p=2310 https://ygraph.com/chart/679

Emerging Automobile (Car) market growth graph in comparisson to mature markets. USA, Western Europe, Japan vs. BRIC (Brazil, Russia, India, China), 2008 Source: http://in.reuters.com/article/2008/09/04/autos-emerging-idINT16557320080904 https://ygraph.com/chart/455

Racial homogeneity as a strong predictor of welfare generosity. Social Spending (percent of GDP) and Racial Fractionalization. Source: http://montclairsoci.blogspot.com/2011/02/those-people.html https://ygraph.com/chart/459

Kitco Silver Chart 2011. Silver Price Chart in 2011. Movement of silver prices in 2011 has been volatile. Peak in May. Source: http://www.kitco.com/ https://ygraph.com/chart/644

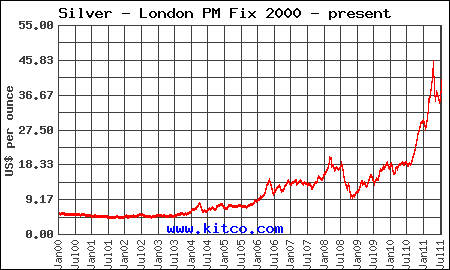
Silver Price Chart. Kitco Silver Chart 2000 – 2011. Silver price growth in past 10 years. Source: http://www.kitco.com/ https://ygraph.com/chart/646

Global Car Sales Growth Slows 2010 – 2011. The US and Japan have seen decreasing sales due to the Japanese tsunami, while China and India are shrinking. Source: http://www.thetruthaboutcars.com/2011/06/chart-of-the-day-global-sales-growth-slows-to-a-crawl/ https://ygraph.com/chart/564
