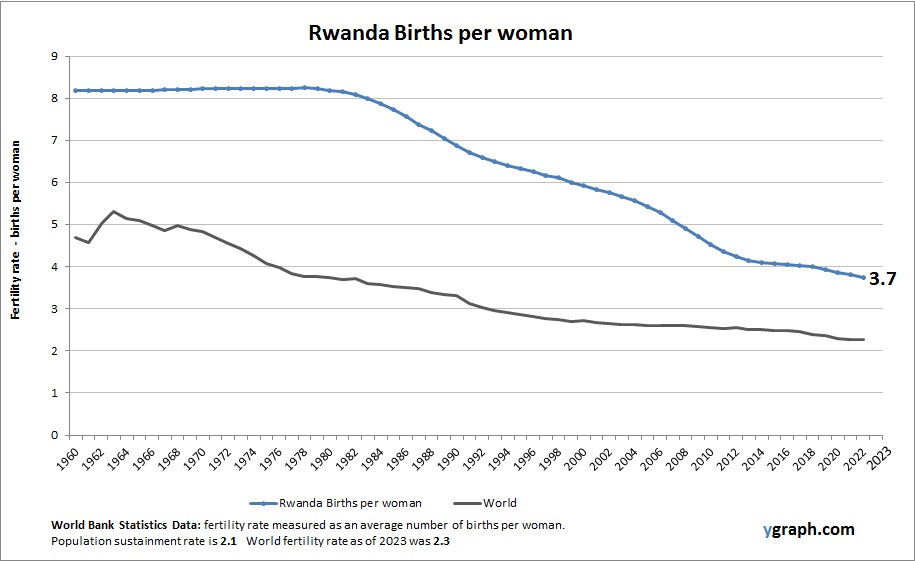
Chart above demonstrates St. Kitts and Nevis Births per woman. The fertility rate statistics are compiled by World Bank. Based on the latest demographics info provided for St. Kitts and Nevis.
The above graph shows Antigua and Barbuda Births per woman. World Bank is the source of this birth data. Based on the latest available information for Antigua and Barbuda.
Chart above demonstrates Sub Saharan Africa Births per woman. The fertility rate statistics are compiled by World Bank. Based on the latest available information for Sub Saharan Africa.
This diagram presents Syria Births per woman. This is according to World Bank birth stats by country. Based on the latest available information for Syria.
Chart above demonstrates Denmark Births per woman. This is according to World Bank birth stats by country. Latest births per woman information for Denmark.
The above graph shows Upper middle income Population. This is according to World Bank total population stats. Latest population information for Upper middle income.
Chart above demonstrates Republic of the Congo Population. The country statistics are compiled by World Bank. Based on the latest available information for Republic of the Congo.
Chart above demonstrates Senegal Births per woman. The fertility rate statistics are compiled by World Bank. Latest births per woman information for Senegal.