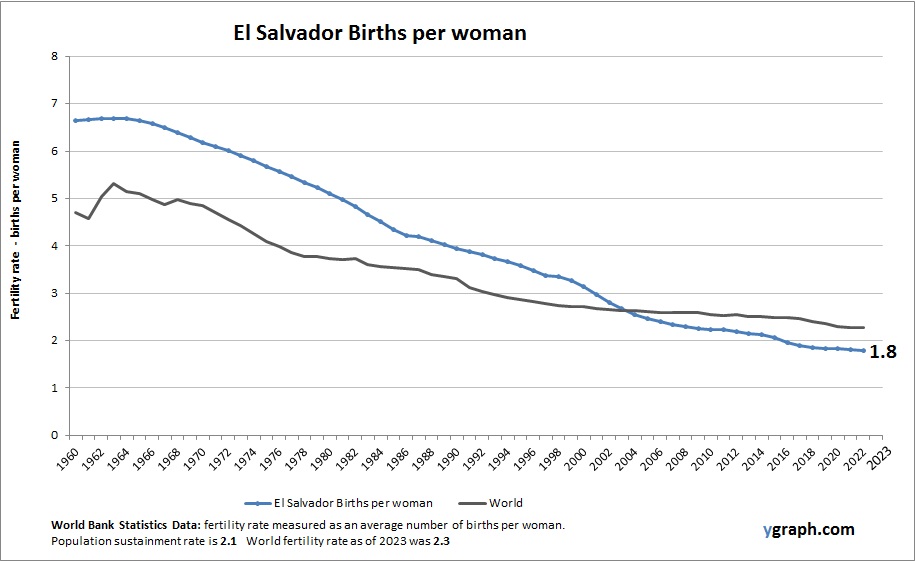
Kenya Population

This diagram presents Kenya Population. World Bank is the source of this population data. Based on the latest available information for Kenya.

Kenya has a large and fast-growing population, driven by high birth rates and a significant youth demographic. Urbanization is accelerating, and while fertility is gradually declining, population momentum ensures continued growth in coming decades, posing both opportunities and challenges for development.

Kenya Population

British Virgin Islands Population

This diagram presents British Virgin Islands Population. World Bank is the source of this population data. Based on the latest available information for British Virgin Islands.

The British Virgin Islands have a small population that fluctuates with migration trends and tourism-driven economic activity. Fertility rates are moderate, and the demographic structure is shaped by both native islanders and expatriates seeking economic opportunities.

British Virgin Islands Population

European Union Population

This diagram presents European Union Population. World Bank is the source of this population data. Based on the latest demographics info provided for European Union.

The European Union has a large population characterized by low fertility rates and an aging demographic. Population growth is largely driven by immigration. Urbanization is widespread, and member states face challenges related to workforce sustainability, social welfare, and integration of migrants. Policies aim to balance demographic trends with economic growth and social cohesion.

European Union Population

West Bank and Gaza Population

The above graph shows West Bank and Gaza Population. The country statistics are compiled by World Bank. Based on the latest demographics info provided for West Bank and Gaza.

The West Bank and Gaza have a young and rapidly growing population with high fertility rates. Political and economic challenges influence demographic trends, while urbanization and migration affect population distribution and growth patterns.

West Bank and Gaza Population

United States Births per woman

This diagram presents United States Births per woman. This is according to World Bank birth stats by country. Based on the latest demographics info provided for United States.

The United States has a fertility rate near or slightly below replacement level, influenced by diverse social and economic factors. Immigration helps maintain population growth, while urbanization, education, and economic conditions shape family size decisions. Healthcare access and cultural diversity create varied demographic experiences.

United States Births per woman

Liberia Population

This diagram presents Liberia Population. The country statistics are compiled by World Bank. Latest population information for Liberia.

Liberia’s population is youthful and growing, with high birth rates driving demographic expansion. Recovery from years of conflict and investment in health and education have led to gradual improvements, although challenges persist in rural healthcare access. Urbanization is increasing, particularly in Monrovia, as people seek better services and opportunities.

Liberia Population

Mauritius Births per woman

Chart above demonstrates Mauritius Births per woman. The fertility rate statistics are compiled by World Bank. Based on the latest demographics info provided for Mauritius.

Mauritius has undergone a successful demographic transition with low and stable fertility rates. Improvements in education, healthcare, and economic development have supported smaller family sizes, while aging and workforce dynamics are growing areas of focus.

Mauritius Births per woman

China Births per woman

This diagram presents China Births per woman. World Bank is the source of this birth data. Based on the latest demographics info provided for China.

China’s fertility rate has dropped significantly in recent decades due to government policies and socioeconomic changes. Although the one-child policy has been relaxed, birth rates remain below replacement level. This has led to a rapidly aging population and concerns about future labor force shortages, prompting new incentives to encourage families to have more children.

China Births per woman

Dominica Births per woman

This diagram presents Dominica Births per woman. World Bank is the source of this birth data. Latest births per woman information for Dominica.

Dominica has moderate fertility rates with a slow population growth trajectory. Migration and urbanization impact demographic trends, while social policies and healthcare improvements contribute to family planning and smaller family sizes.

Dominica Births per woman

South Korea Births per woman

This diagram presents South Korea Births per woman. The fertility rate statistics are compiled by World Bank. Latest births per woman information for South Korea.

South Korea has one of the lowest fertility rates globally, resulting in a rapidly aging population and population decline concerns. Economic pressures, career demands, and housing costs contribute to very low birth rates, prompting government efforts to support families and increase fertility.

South Korea Births per woman