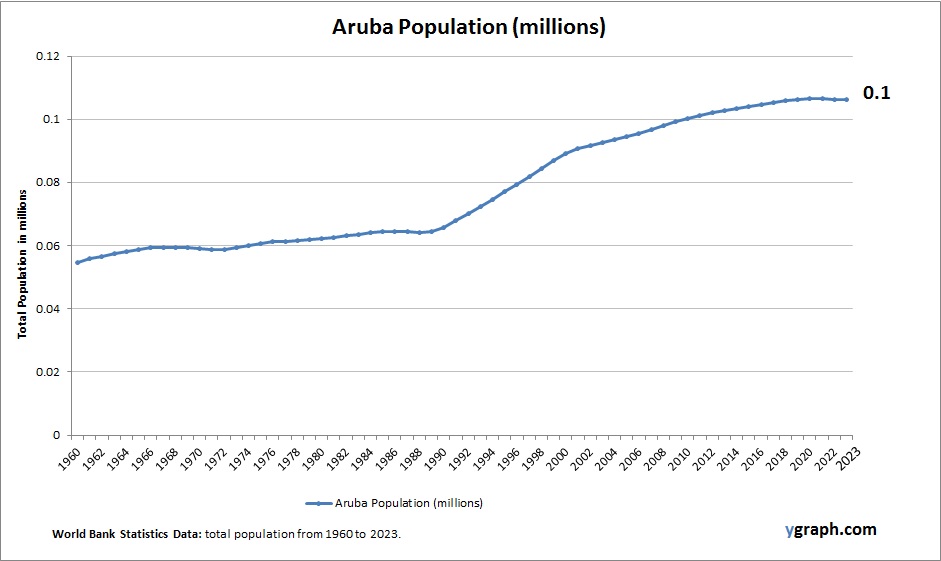
Cameroon Population

Chart above demonstrates Cameroon Population. This is according to World Bank total population stats. Based on the latest available information for Cameroon.

Cameroon’s population is large and rapidly growing, sustained by high fertility rates, particularly in rural areas. Despite increasing urbanization and development, access to family planning remains uneven, contributing to continued demographic expansion and a youthful population.

Cameroon Population

Liechtenstein Population

Chart above demonstrates Liechtenstein Population. The country statistics are compiled by World Bank. Based on the latest demographics info provided for Liechtenstein.

Liechtenstein has a small, stable population supported by moderate fertility rates and immigration. The country’s high standard of living and economic prosperity attract residents, while urbanization is concentrated in a few key municipalities. Demographic changes tend to be gradual and predictable.

Liechtenstein Population

Lebanon Births per woman

Chart above demonstrates Lebanon Births per woman. This is according to World Bank birth stats by country. Based on the latest available information for Lebanon.

Lebanon has seen a declining fertility rate over the years, influenced by urbanization, economic challenges, and shifting social norms. Political instability has also impacted population growth, leading to increased emigration and a changing demographic landscape.

Lebanon Births per woman

Trinidad and Tobago Population

This diagram presents Trinidad and Tobago Population. World Bank is the source of this population data. Latest population information for Trinidad and Tobago.

Trinidad and Tobago’s population growth is slow, with low fertility rates balanced by moderate immigration and emigration flows. Aging demographics are becoming increasingly prominent, impacting social services and economic productivity. Urban areas dominate the population distribution, with economic reliance on energy, manufacturing, and services sectors shaping demographic trends. Public policies focus on managing population aging and encouraging family growth amid changing social norms.

Trinidad and Tobago Population

Montenegro Births per woman

This diagram presents Montenegro Births per woman. The fertility rate statistics are compiled by World Bank. Based on the latest available information for Montenegro.

Montenegro has low fertility rates below replacement level, leading to concerns about population decline and aging. Urbanization and emigration of young people contribute to demographic challenges. Government policies focus on encouraging family growth and addressing labor market sustainability.

Montenegro Births per woman

Mauritius Population

The above graph shows Mauritius Population. World Bank is the source of this population data. Based on the latest available information for Mauritius.

Mauritius has a growing population with moderate fertility rates. The country benefits from a stable economy, good healthcare, and education systems, contributing to increasing life expectancy and urbanization. The demographic structure is gradually aging, though still relatively young compared to developed nations.

Mauritius Population

Namibia Population

Chart above demonstrates Namibia Population. The country statistics are compiled by World Bank. Latest population information for Namibia.

Namibia has a youthful population with moderate to high fertility rates. Economic development and urbanization are gradually shaping demographic trends, while rural areas maintain larger family sizes and traditional lifestyles.

Namibia Population

Lower middle income Population

Chart above demonstrates Lower middle income Population. World Bank is the source of this population data. Latest population information for Lower middle income.

Countries in the lower-middle-income category typically experience moderate to high fertility rates, younger populations, and fast urbanization. These regions are in various stages of demographic transition, balancing development goals with the pressures of rapid population growth.

Lower middle income Population

Russia Population

Chart above demonstrates Russia Population. The country statistics are compiled by World Bank. Based on the latest available information for Russia.

Russia faces a declining and aging population, with fertility rates consistently below replacement level. Efforts to boost birth rates through financial incentives and family support have had limited long-term impact, while emigration and low life expectancy also affect demographic trends.

Russia Population

Namibia Births per woman

This diagram presents Namibia Births per woman. This is according to World Bank birth stats by country. Based on the latest available information for Namibia.

Namibia maintains moderate fertility rates, with a declining trend due to urbanization, education improvements, and enhanced access to family planning. The population is young, and health challenges persist in some rural areas. Economic development and social policies aim to address population growth and promote sustainable development.

Namibia Births per woman