Turkmenistan Births per woman

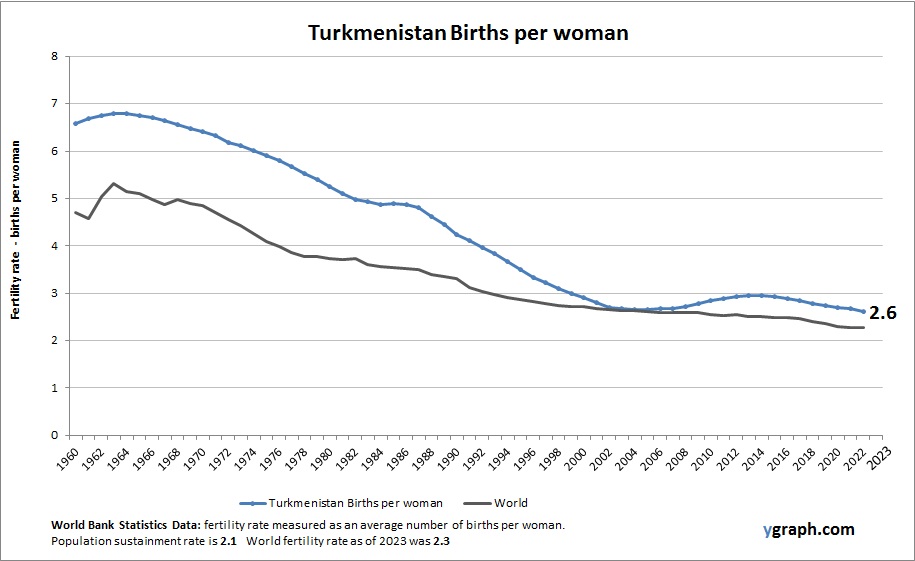
This diagram presents Turkmenistan Births per woman. The fertility rate statistics are compiled by World Bank. Based on the latest available information for Turkmenistan.

Turkmenistan has moderate fertility rates, influenced by traditional values and a centralized health system. Urbanization and increased access to education are gradually reducing birth rates, but larger family sizes are still common in many parts of the country.

Turkmenistan Births per woman

Sierra Leone Population

The above graph shows Sierra Leone Population. World Bank is the source of this population data. Latest population information for Sierra Leone.

Sierra Leone has a rapidly growing population driven by high fertility rates and a young demographic. Post-conflict recovery and improvements in healthcare have reduced mortality but population pressures on education, employment, and infrastructure remain significant. Urbanization is increasing but rural areas still dominate.

Sierra Leone Population

Guam Births per woman

Chart above demonstrates Guam Births per woman. World Bank is the source of this birth data. Based on the latest demographics info provided for Guam.

Guam exhibits moderate fertility rates, higher than mainland U.S. averages, influenced by traditional cultural values and a younger population. The island’s demographics are shaped by a combination of natural growth and the movement of military personnel and their families.

Guam Births per woman

Mauritania Population

Chart above demonstrates Mauritania Population. The country statistics are compiled by World Bank. Latest population information for Mauritania.

Mauritania has a young and rapidly growing population, supported by high fertility rates and improving healthcare. Urbanization is increasing, although the majority of the population still lives in rural areas. Economic challenges and environmental factors, such as desertification, shape demographic patterns, while government efforts focus on managing growth sustainably.

Mauritania Population

Arab World Population

The above graph shows Arab World Population. World Bank is the source of this population data. Based on the latest demographics info provided for Arab World.

The Arab World as a region has experienced significant population growth, fueled by high fertility rates and a youthful demographic structure. While some countries like Lebanon and Tunisia are seeing declines in births per woman, others such as Yemen and Iraq still have high fertility. Urbanization and economic development are beginning to reshape these dynamics.

Arab World Population

Turkiye Births per woman

This diagram presents Turkiye Births per woman. World Bank is the source of this birth data. Latest births per woman information for Turkiye.

Turkey’s fertility rate has declined significantly in recent decades due to urbanization, education, and economic development. While still above many European countries, birth rates are near replacement level. Population growth is moderate, with internal migration influencing urban demographics. Family policies aim to balance demographic trends with economic needs.

Turkiye Births per woman

Belize Population

This diagram presents Belize Population. This is according to World Bank total population stats. Based on the latest demographics info provided for Belize.

Belize’s population is small but growing at a moderate pace. Urbanization, youth migration, and a relatively high birth rate shape the country’s demographic profile, with a young population structure and increasing access to healthcare and education.

Belize Population

Nepal Births per woman

Chart above demonstrates Nepal Births per woman. The fertility rate statistics are compiled by World Bank. Latest births per woman information for Nepal.

Nepal has experienced a significant decline in fertility rates over recent decades due to increased education, healthcare access, and urbanization. Despite this, birth rates remain moderately high compared to global averages. Population growth continues, influenced by rural-urban migration and development efforts.

Nepal Births per woman

Netherlands Births per woman

Chart above demonstrates Netherlands Births per woman. This is according to World Bank birth stats by country. Based on the latest demographics info provided for Netherlands.

The Netherlands experiences low fertility rates, typical of Western European countries, influenced by factors such as delayed childbearing, high female labor participation, and widespread access to contraception. Although birth rates hover below replacement level, immigration helps sustain population size. Policies supporting work-life balance and family welfare contribute to demographic stability.

Netherlands Births per woman

Portugal Population

The above graph shows Portugal Population. World Bank is the source of this population data. Based on the latest available information for Portugal.

Portugal’s population is stable or slowly declining due to low fertility rates and emigration. Urban centers such as Lisbon and Porto attract residents, while rural areas face depopulation and aging demographics. Government initiatives seek to encourage family growth and immigration to support demographic balance.

Portugal Population